

Data visualization can be used to compare options. Example: Consider the Management Insight box Are Robotic Workers
Question:
Data visualization can be used to compare options.
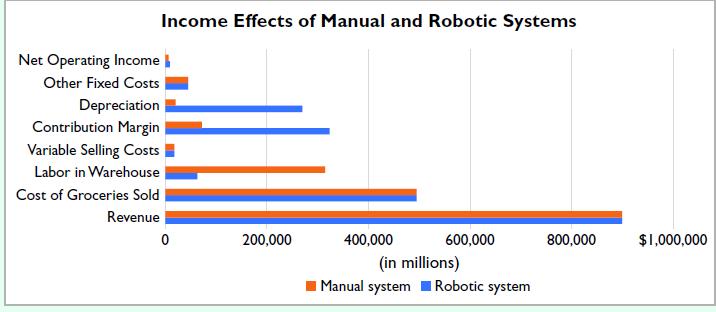
Example: Consider the Management Insight box “Are Robotic Workers More Humane?” presented in the chapter. Data analytics can help Kroger determine if using robots in its warehouse would be a cost-effective decision. Consider the following chart, which compares income effects in both a manual and a robotic system. When using human labor in a manual system, we see that labor costs are substantial. When a robotic system is utilized, we see that depreciation is a larger cost item, and labor is much less.
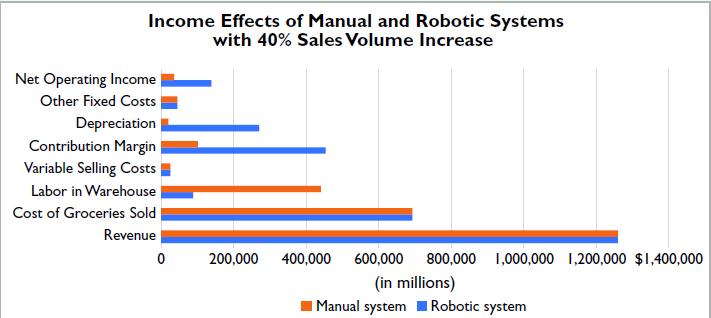
If we assume that revenues will increase 40% due to an increased sales volume, what effect will we see on net operating income? As shown in the following chart, the increase in net operating income is larger in an automated system. This is because the labor increase was a smaller dollar amount than the respective increase in a manual system, coupled with no increase in total fixed costs. This effect is often referred to as operating leverage, which is discussed further in Chapter 6.
For this case, you will use an approach similar to that used in the example just presented. You will help a fast food restaurant evaluate the benefits of installing a kiosk in the lobby to automate customer orders, thus reducing the need for cashiers. This case requires you to compare income statement data for traditional and digital ordering for the restaurant, and then create and analyze a bar chart. Go to WileyPLUS for complete case details and instructions.
Step by Step Answer:


Managerial Accounting Tools For Business Decision Making
ISBN: 9781119754053
9th Edition
Authors: Jerry J Weygandt, Paul D Kimmel, Jill E Mitchell
