

Data visualization can be used to review company results. Example: Recall the Management Insight Supplying Todays (Not
Question:
Data visualization can be used to review company results.
Example: Recall the Management Insight “Supplying Today’s (Not Yesterday’s) Fashion” presented in the chapter. Data analytics can help Inditex determine how it is performing over time. For retailers, the gross margin percentage is a good measure of how the company is doing, as it indicates what percentage of sales is available to cover selling and administration costs and generate profit. From publicly available data, we can calculate Inditex’s gross margin percentage [(Sales – Cost of goods sold) ÷ Sales] and track it over time. What do you observe when you look at the following chart?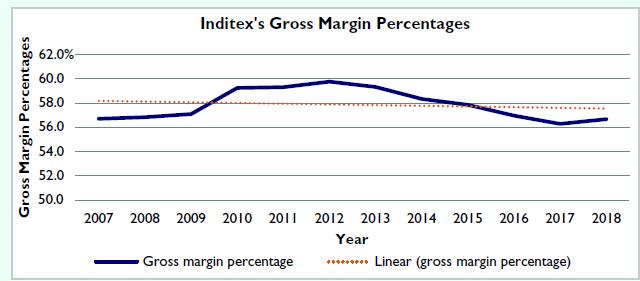
Hopefully, you immediately noticed that Inditex is able to maintain a high and stable gross margin over the time period shown. Management should be quite pleased with this. But another measure of success, revenue per employee, can provide management with even more insight concerning its sales. This case will require you to calculate and graph this data for Inditex and then analyze the results. Go to WileyPLUS for complete case details and instructions
Step by Step Answer:
Looking at the chart we can see that Inditex gross margin percentage has been steadily i...View the full answer


Managerial Accounting Tools For Business Decision Making
ISBN: 9781119754053
9th Edition
Authors: Jerry J Weygandt, Paul D Kimmel, Jill E Mitchell
