

The figure below shows the marginal damage (MD) curve and the marginal abatement cost (MAC) curve facing
Question:
The figure below shows the marginal damage (MD) curve and the marginal abatement cost (MAC) curve facing an industry that discharges a pollutant into the environment.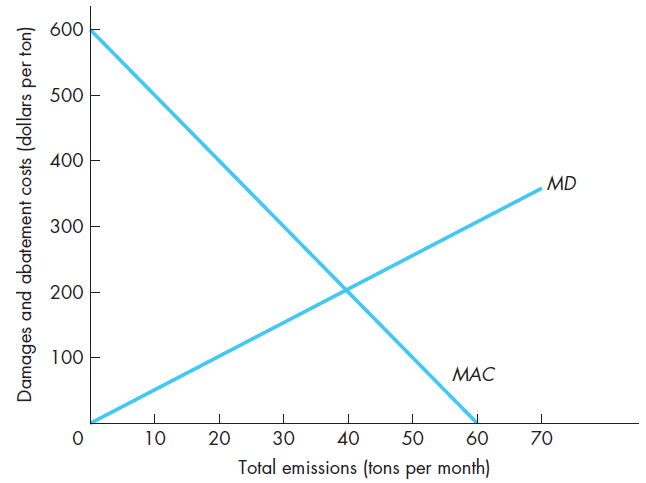
a. If environment regulations do not restrict pollution by this industry, the industry would discharge________ tons per month. At this level of emissions, total damage caused by pollution would be $________ per month, and total abatement cost would be $________ per month. Total social cost of pollution in this industry would be $________ per month in the absence of any government restrictions on pollution.b. If environmental officials banned all pollution, forcing the industry to eliminate all pollution discharges, then total abatement cost for the industry would be $________ per month, and total social cost of zero pollution in this industry would be $________ per month.c. Why is zero pollution in this industry not optimal from society?s point of view? Explain carefully using the figure above.d. The socially optimal level of emissions for this industry is________ tons per month, which results in a total abatement cost of $________ per month, and total damage from pollution of $________ per month. Total social cost is $ per month.e. At the optimal level of pollution in part d, exactly what is maximized or minimized?
f. What is the optimal level of abatement from society?s point of view?g. If environmental authorities wished to control pollution in this industry by imposing an emission tax on pollution, the tax per ton of discharge should be set at $________ per ton. At this tax rate, the industry discharges________ tons per month and pays a total tax bill of $________ per month. The industry abates tons per month and incurs a total abatement cost of $________ per month.
Step by Step Answer:
a If environment regulations do not restrict pollution by this industry the industry would discharge 60 tons per month At this level of emissions tota...View the full answer


Managerial Economics Foundations of Business Analysis and Strategy
ISBN: 978-0078021909
12th edition
Authors: Christopher Thomas, S. Charles Maurice
