

The firms in the competitive industry shown in the figure below generate a negative externality in the
Question:
The firms in the competitive industry shown in the figure below generate a negative externality in the process of supplying the product. The marginal external cost imposed on society is given by the MEC curve, and the marginal private cost of production, MPC, is given by the industry supply curve, S. Industry demand, D, measures the marginal social benefits (MSB) of consuming this product, because there are no spillover costs or benefits caused by consuming this good.
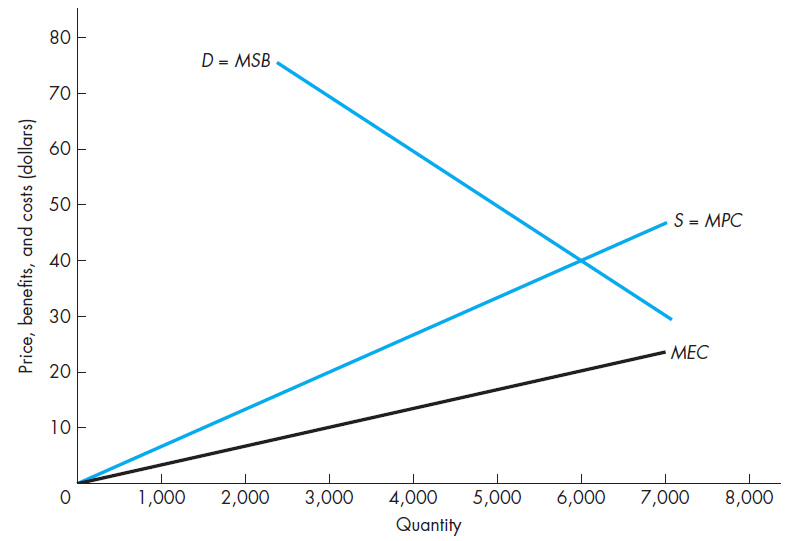 a. For the 300,000th unit produced by this industry, the marginal external cost is $ __________, the marginal private cost is $ __________, and the marginal social cost is $ __________.b. Construct the marginal social cost curve and label it MSC.c. In competitive equilibrium, the industry will produce __________units. This level of output is __________(productively, allocatively) inefficient because __________is greater than __________.d. The competitive equilibrium results in a deadweight loss of $ __________.e. The socially efficient level of output for this industry is __________units, where marginal social benefit equals __________.
Step by Step Answer:
a For 3000 units MEC 10 MPC20 MSC MPCMEC MSC 102030 For 30000unitsie 3000100 units MEC 1...View the full answer


Managerial Economics Foundations of Business Analysis and Strategy
ISBN: 978-0078021909
12th edition
Authors: Christopher Thomas, S. Charles Maurice
