

The figure on the next page shows a long-run industry supply curve (SLR) and the demand curve
Question:
The figure on the next page shows a long-run industry supply curve (SLR) and the demand curve (D) facing the competitive industry.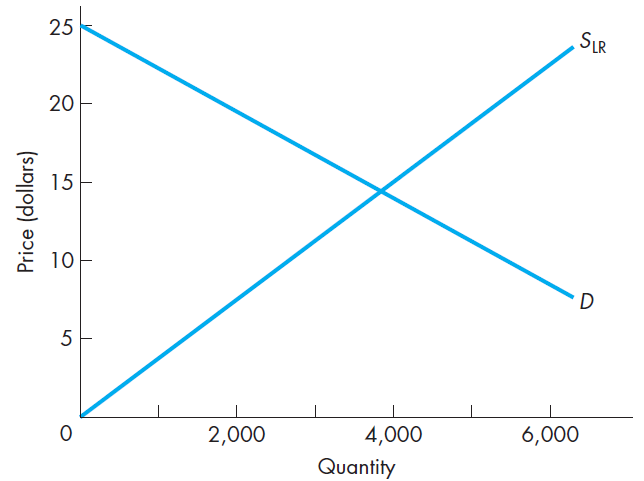
a. In long-run competitive equilibrium, the industry will produce____________ units of the good and sell these units at a market-clearing price of $____________ per unit.b. The long-run marginal cost at the equilibrium output in part a is $ ____________, and the long-run average cost at the equilibrium output is $ ____________.c. Assume the firms in this industry employ inputs of varying quality and productivity, and respond to this statement: ?Even though the firms with the higher quality inputs have lower costs than their rivals, all firms in the industry earn the same amount of economic profit.? Is this statement true or false? Explain.d. Total producer surplus in long-run competitive equilibrium is $____________ for this industry.
e. Every firm in this industry earns economic profit equal to $ ____________ , and the high quality resources earn total economic rents equal to $ ____________.f. If all resources used by this industry are of equal quality (and equal productivity), what would the long-run industry supply curve look like? How much producer surplus would be generated in equilibrium? How much economic rent would be paid to resources used by the firms?
Step by Step Answer:
A In long run comparative equilibrium the industry will produce 4000 unit of the good and sale these ...View the full answer


Managerial Economics Foundations of Business Analysis and Strategy
ISBN: 978-0078021909
12th edition
Authors: Christopher Thomas, S. Charles Maurice
