

Look back at Figure 8 6A. Fig 8-6A (a). Run the percentages vertically and explain what they
Question:
Look back at Figure 8 –6A.
Fig 8-6A
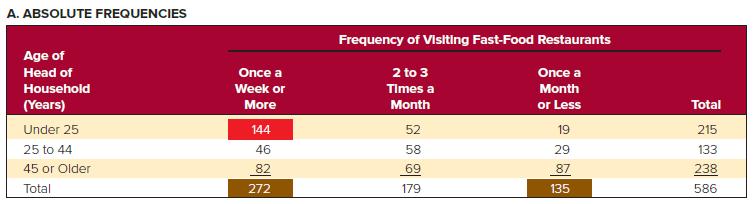 (a). Run the percentages vertically and explain what they mean.
(b). Express all numbers in the table as a percentage of the total number of people sampled (586) and explain what the percentages mean.
Fantastic news! We've Found the answer you've been seeking!
Step by Step Answer:
lets calculate the percentages a Running the percentages vertically Age of Head of Household Years ...View the full answer

Answered By
Asd fgh
sadasmdna,smdna,smdna,msdn,masdn,masnd,masnd,m asd.as,dmas,dma.,sd as.dmas.,dma.,s ma.,sdm.,as mda.,smd.,asmd.,asmd.,asmd.,asm
1+ Reviews
15+ Question Solved
Related Book For 

Question Posted:
