

The following table shows the U.S. population (in thousands) of individuals age 100 years or older for
Question:
The following table shows the U.S. population (in thousands) of individuals age 100 years or older for selected years from 2010 and projected to 2050.
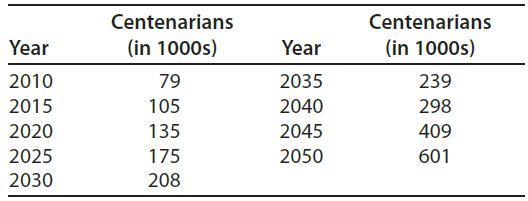
(a) Display these data with a bar graph.
(b) Find the mean and standard deviation of these data for the U.S. population of centenarians.
Fantastic news! We've Found the answer you've been seeking!
Step by Step Answer:
a b Using technology x 2499 s 16...View the full answer

Answered By
STEPHEN KAHURA
Hi! I am PROF HAJI and I am highly motivated, deadline reaching, target meeting, all-around writing professionally.
I focus on delivering factual, informative and compelling content that is 100% unique to generate quality leads that will keep you coming back for more!
I look forward to working with you and provI'm dedicated, enthusiastic and focused on my work in order to satisfy my clients efficiently. I have made over 1000+ 5 STAR sales This is my full-time job and primary focus. Providing you with the best quality content I can produce.
Just try out my services, I will not let you down.
Thanks and God bless!
0 Reviews
10+ Question Solved
Related Book For 

Mathematical Applications For The Management, Life And Social Sciences
ISBN: 9781337625340
12th Edition
Authors: Ronald J. Harshbarger, James J. Reynolds
Question Posted:
