

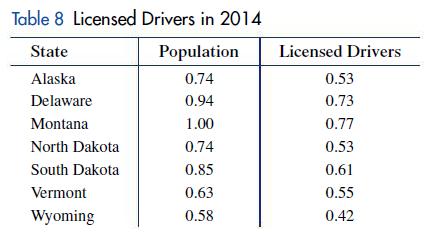
Table 8 contains the state population and the number of licensed drivers in the state (both in
Question:
Table 8 contains the state population and the number of licensed drivers in the state (both in millions) for the states with population under 1 million in 2014. The regression model for this data is y = 0.75x where x is the state population (in millions) and y is the number of licensed drivers (in millions) in the state.
(A) Draw a scatter plot of the data and a graph of the model on the same axes.
(B) If the population of Hawaii in 2014 was about 1.4 million, use the model to estimate the number of licensed drivers in Hawaii in 2014 to the nearest thousand.
(C) If the number of licensed drivers in Maine in 2014 was about 1,019,000, use the model to estimate the population of Maine in 2014 to the nearest thousand.
Step by Step Answer:

This question has not been answered yet.
You can Ask your question!


Finite Mathematics For Business Economics Life Sciences And Social Sciences
ISBN: 9780134862620
14th Edition
Authors: Raymond Barnett, Michael Ziegler, Karl Byleen, Christopher Stocker
