

The graph below represents the average points per game of a certain basketball player from 19952000. What
Question:
The graph below represents the average points per game of a certain basketball player from 1995–2000. What is the percent increase over the 6-year period to the nearest hundredth of a percent?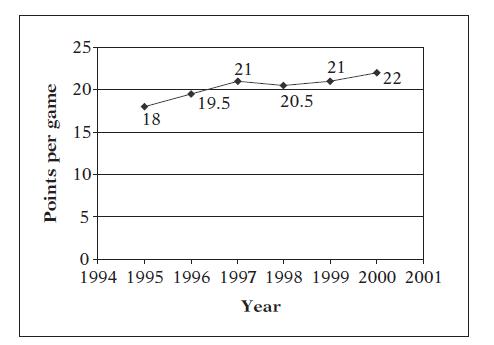
A. 18%
B. 18.18%
C. 20%
D. 22%
E. 22.22%
Fantastic news! We've Found the answer you've been seeking!
Step by Step Answer:
E Divide the change ...View the full answer

Answered By
Fahmin Arakkal
Tutoring and Contributing expert question and answers to teachers and students.
Primarily oversees the Heat and Mass Transfer contents presented on websites and blogs.
Responsible for Creating, Editing, Updating all contents related Chemical Engineering in
latex language
8+ Reviews
22+ Question Solved
Related Book For 

McGraw Hills Conquering SAT Math
ISBN: 9780071493413
2nd Edition
Authors: Robert Postman, Ryan Postman
Question Posted:
