

Draw a graph of the relationship between the revenue per theater on the y-axis and the number
Question:
Draw a graph of the relationship between the revenue per theater on the y-axis and the number of theaters on the x-axis. Describe the relationship.
Use the following news clip to work Problems 4 to 6.
Clash of the Titans Tops Box Office With Sales of $61.2 Million: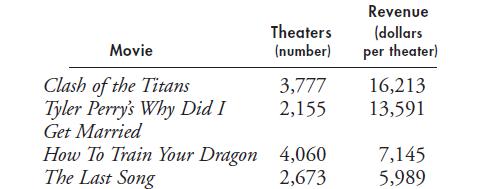
Fantastic news! We've Found the answer you've been seeking!
Step by Step Answer:
The graph illustrates the relationship between the revenue per theater yaxis and the number of theat...View the full answer

Answered By
Pushpinder Singh
Currently, I am PhD scholar with Indian Statistical problem, working in applied statistics and real life data problems. I have done several projects in Statistics especially Time Series data analysis, Regression Techniques.
I am Master in Statistics from Indian Institute of Technology, Kanpur.
I have been teaching students for various University entrance exams and passing grades in Graduation and Post-Graduation.I have expertise in solving problems in Statistics for more than 2 years now.I am a subject expert in Statistics with Assignmentpedia.com.
3+ Reviews
10+ Question Solved
Related Book For 

Question Posted:
