

The accompanying table shows data on the total number of people in the United States and the
Question:
The accompanying table shows data on the total number of people in the United States and the number of all people who were uninsured, for selected years from 2005 to 2017.
It also shows data on the total number of poor children in the United States — those under 18 and below the poverty threshold — and the number of poor children who were uninsured.
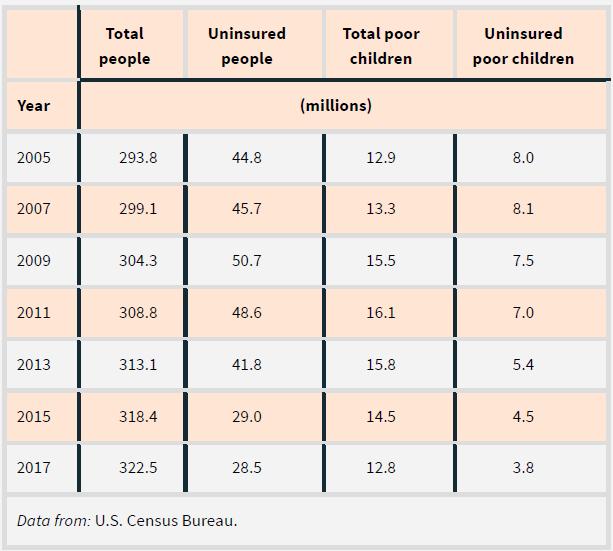
For each year, calculate the percentage of all people who were uninsured and the percentage of poor children who were uninsured. How have these percentages changed over time? What is a possible explanation for the change in the percentage of uninsured poor children?
Fantastic news! We've Found the answer you've been seeking!
Step by Step Answer:

Answered By
PALASH JHANWAR
I am a Chartered Accountant with AIR 45 in CA - IPCC. I am a Merit Holder ( B.Com ). The following is my educational details.
PLEASE ACCESS MY RESUME FROM THE FOLLOWING LINK: https://drive.google.com/file/d/1hYR1uch-ff6MRC_cDB07K6VqY9kQ3SFL/view?usp=sharing
3+ Reviews
10+ Question Solved
Related Book For 

Question Posted:
