

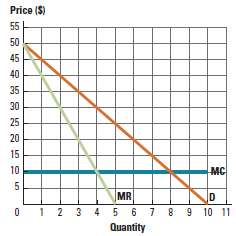
Figure 14P-3 presents the demand curve, marginal revenue, marginal costs, and average total costs facing a monopolist
Question:
a. Plot the profit-maximizing price and quantity on the graph.
b. Under monopoly pricing, are profits positive, negative, or zero?
c. Draw the deadweight loss under monopoly pricing.
d. If government mandates P = ATC, are profits positive, negative, or zero? Compared to monopoly pricing, is deadweight loss smaller, larger, or the same size?
e. If government mandates efficient pricing, are profits positive, negative, or zero? Compared to monopoly pricing, is deadweight loss under efficient pricing smaller, larger, or the same size? Compared to a mandate where P = ATC, is deadweight loss under efficient pricing smaller, larger, or the same size?
f. Is this a natural monopoly?
Figure 14P-3:
Fantastic news! We've Found the answer you've been seeking!
Step by Step Answer:
a The profitmaximizing level of output is 4 because this is where MR MC The monopolist will cha...View the full answer

Answered By
Utsab mitra
I have the expertise to deliver these subjects to college and higher-level students. The services would involve only solving assignments, homework help, and others.
I have experience in delivering these subjects for the last 6 years on a freelancing basis in different companies around the globe. I am CMA certified and CGMA UK. I have professional experience of 18 years in the industry involved in the manufacturing company and IT implementation experience of over 12 years.
I have delivered this help to students effortlessly, which is essential to give the students a good grade in their studies.
2+ Reviews
10+ Question Solved
Related Book For 
Question Posted:
