Listed in the following table are two sets of figures: the total quantity of Mexican pesos (new
Question:
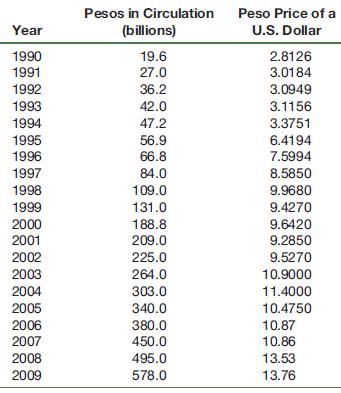
Listed in the following table are two sets of figures: the total quantity of Mexican pesos (new pesos) in circulation (the total amount of Mexican money available) and the peso price of a U.S. dollar (how many pesos are needed to purchase one U.S. dollar).
Values are given for the years 1990–2009 for each variable.
a. Plot each variable by measuring time (years) on the horizontal axis and, in the first graph, pesos in circulation on the vertical axis and, in the second graph, peso price of a dollar on the vertical axis.
b. Plot the combinations of variables by measuring pesos in circulation on the horizontal axis and peso prices of a dollar on the vertical axis.
c. In each of the graphs in parts a and b, what are the dependent and independent variables?
d. In each of the graphs in parts a and b, indicate whether the relationship between the dependent and independent variables is direct or inverse.
Step by Step Answer:

This question has not been answered yet.
You can Ask your question!