

Plot the data listed in the table below. a. Use price as the vertical axis and quantity
Question:
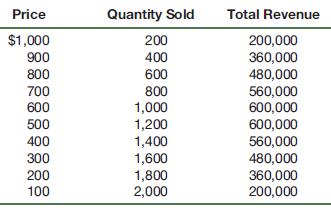
Plot the data listed in the table below.
a. Use price as the vertical axis and quantity as the horizontal axis and plot the first two columns.
b. Show what quantity is sold when the price is $550.
c. Directly below the graph in part a, plot the data in columns 2 and 3. Use total revenue as the vertical axis and quantity as the horizontal axis.
d. What is total revenue when the price is $550? Will total revenue increase or decrease when the price is lowered?
Step by Step Answer:

This question has not been answered yet.
You can Ask your question!
Related Book For 

Question Posted:
