

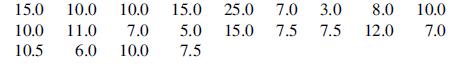
In a survey, students gave their study time per week (h), and here are the 22 values:
Question:
In a survey, students gave their study time per week (h), and here are the 22 values:
A 95% confidence interval for the population mean μ is desired.
a. Compute the t-based confidence interval of Section 8.2.
b. Create a normal probability plot. Is it apparent that the data set is not normal, so the t-based interval is of questionable validity?
c. Use software to generate a bootstrap sample of means. Create a histogram of the resulting x̅* values.
d. Use the standard deviation for part (c) to get a 95% bootstrap t confidence interval for μ. Based on the histogram in part (c), is this CI valid?
e. Use part (c) to form the 95% confidence bootstrap percentile interval for μ.
f. Which interval should be used, and why?
Step by Step Answer:

This question has not been answered yet.
You can Ask your question!

Modern Mathematical Statistics With Applications
ISBN: 9783030551551
3rd Edition
Authors: Jay L. Devore, Kenneth N. Berk, Matthew A. Carlton
