

The College Board reports the following Total SAT score distribution for 2018, the first year of the
Question:
The College Board reports the following Total SAT score distribution for 2018, the first year of the “new” SAT format:
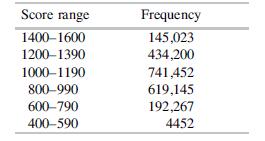
a. Create a histogram of this data. Comment on its features.
b. What is a typical, or representative, Total SAT score?
c. What proportion of students in 2018 scored between 800 and 1190?
Fantastic news! We've Found the answer you've been seeking!
Step by Step Answer:
a Since I am unable to create visual content like a histogram I will describe how you can set up the histogram using the given data To create a histog...View the full answer

Answered By
Utsab mitra
I have the expertise to deliver these subjects to college and higher-level students. The services would involve only solving assignments, homework help, and others.
I have experience in delivering these subjects for the last 6 years on a freelancing basis in different companies around the globe. I am CMA certified and CGMA UK. I have professional experience of 18 years in the industry involved in the manufacturing company and IT implementation experience of over 12 years.
I have delivered this help to students effortlessly, which is essential to give the students a good grade in their studies.
2+ Reviews
10+ Question Solved
Related Book For 
Modern Mathematical Statistics With Applications
ISBN: 9783030551551
3rd Edition
Authors: Jay L. Devore, Kenneth N. Berk, Matthew A. Carlton
Question Posted:
