

Consider the curve in the figure below, which shows the market demand, marginal cost, and marginal revenue
Question:
Consider the curve in the figure below, which shows the market demand, marginal cost, and marginal revenue curve for firms in an oligopolistic industry. In this example, we assume firms have zero fixed costs.
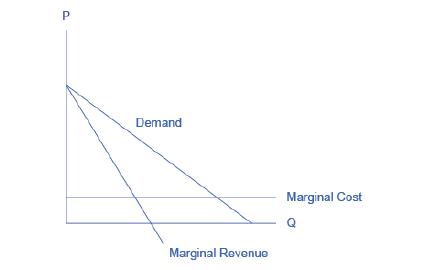
a. Suppose the firms collude to form a cartel. What price will the cartel charge? What quantity will the cartel supply? How much profit will the cartel earn?
b. Suppose now that the cartel breaks up and the oligopolistic firms compete as vigorously as possible by cutting the price and increasing sales. What will be the industry quantity and price? What will be the collective profits of all firms in the industry?
c. Compare the equilibrium price, quantity, and profit for the cartel and cutthroat competition outcomes.
Fantastic news! We've Found the answer you've been seeking!
Step by Step Answer:
a If the firms form a cartel they will act like a monopoly choosing the quantity of output where MR ...View the full answer

Answered By
Parvesh Kumar
I am an experienced Mathematics and Statistics tutor with 10 years of experience teaching students and working professionals. I love teaching students who are passionate to learn subjects or wants to understand any mathematics and statistics concept at graduation or master’s level. I have worked with thousands of students in my teaching career. I have helped students deal with difficult topics and subjects like Calculus, Algebra, Discrete Mathematics, Complex analysis, Graph theory, Hypothesis testing, Probability, Statistical Inference and more. After learning from me, students have found Mathematics and Statistics not dull but a fun subject. I can handle almost all curriculum of mathematics. I did B.Sc (mathematics), M.Sc (mathematics), M.Tech (IT) and am also Gate (CS) qualified. I have worked in various college and school and also provided online tutoring to American and Canadian students. I look forward to discussing with you and make learning a meaningful and purposeful
4+ Reviews
10+ Question Solved
Related Book For 
Question Posted:
