

The graph in Figure 18.19 shows the height h of a projectile after (t) seconds. In Problems
Question:
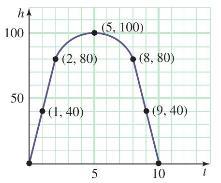
The graph in Figure 18.19 shows the height h of a projectile after \(t\) seconds. In Problems 5-8, find the average rate of change of height (in feet) with respect to the requested changes in time \(t\) (in seconds).
Figure 18.19
1 to \(8 \)
Step by Step Answer:

This question has not been answered yet.
You can Ask your question!
Related Book For 

Question Posted:
