

The graph in Figure 18.19 shows the height h of a projectile after (t) seconds. In Problems
Question:
The graph in Figure 18.19 shows the height h of a projectile after \(t\) seconds. In Problems 5-8, find the average rate of change of height (in feet) with respect to the requested changes in time \(t\) (in seconds).
Figure 18.19
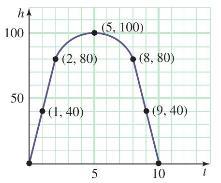
What do you think the rate of change is at \(t=1\) ?
Step by Step Answer:

This question has not been answered yet.
You can Ask your question!
Related Book For 

Question Posted:
