

For each of the six plots, identify the strength of the relationship (e.g. weak, moderate, or strong)
Question:
For each of the six plots, identify the strength of the relationship (e.g. weak, moderate, or strong) in the data and whether fitting a linear model would be reasonable.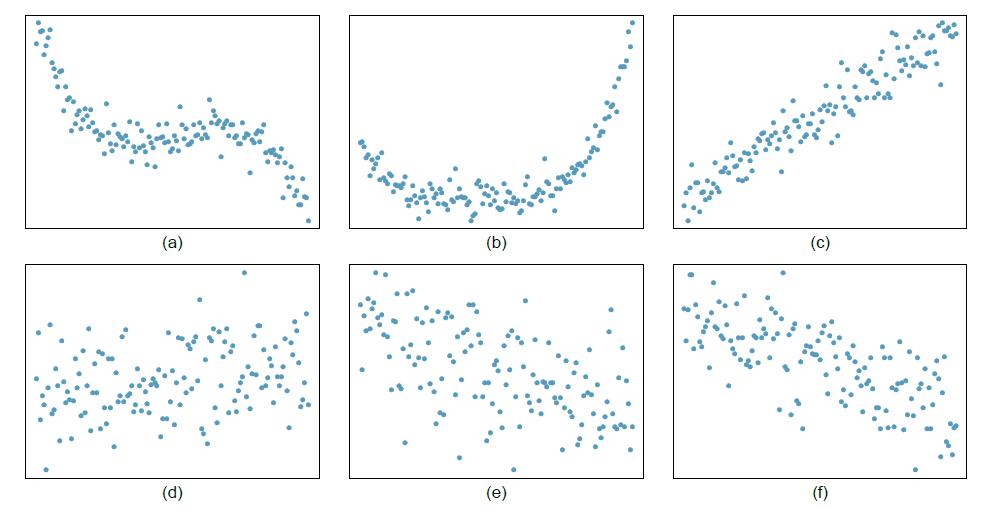
Fantastic news! We've Found the answer you've been seeking!
Step by Step Answer:
Lets assess each plot one by one and discuss the strength of the relationship between the data point...View the full answer

Answered By
Daniel Kimutai
I am a competent academic expert who delivers excellent writing content from various subjects that pertain to academics. It includes Electronics engineering, History, Economics, Government, Management, IT, Religion, English, Psychology, Sociology, among others. By using Grammarly and Turnitin tools, I make sure that the writing content is original and delivered in time. For seven years, I have worked as a freelance writer, and many scholars have achieved their career dreams through my assistance.
1+ Reviews
10+ Question Solved
Related Book For 
OpenIntro Statistics
ISBN: 9781943450077
4th Edition
Authors: David Diez, Mine Çetinkaya-Rundel, Christopher Barr
Question Posted:
