

The two scatterplots below show the relationship between final and mid-semester exam grades recorded during several years
Question:
The two scatterplots below show the relationship between final and mid-semester exam grades recorded during several years for a Statistics course at a university.
(a) Based on these graphs, which of the two exams has the strongest correlation with the final exam grade? Explain.
(b) Can you think of a reason why the correlation between the exam you chose in part (a) and the final exam is higher?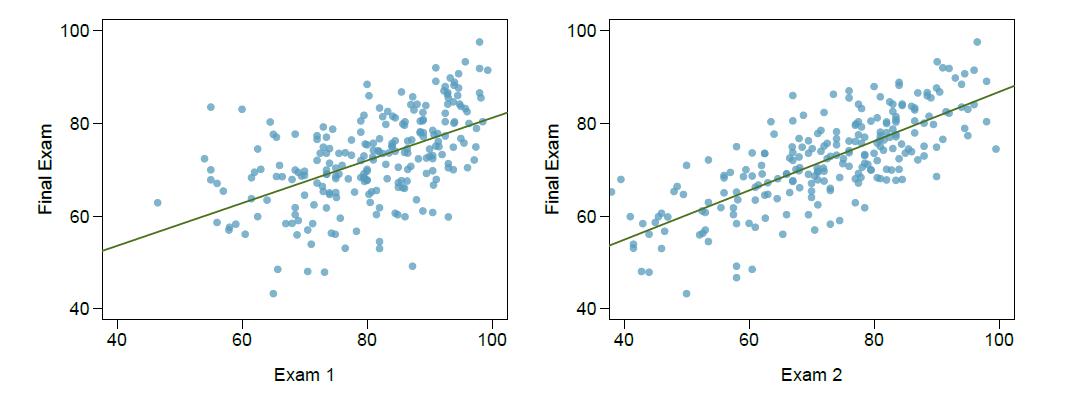
Fantastic news! We've Found the answer you've been seeking!
Step by Step Answer:
a To determine which of the two exams shows the strongest correlation with the final exam grade we need to look at how tightly the points in the scatt...View the full answer

Answered By
Antony Mutonga
I am a professional educator and writer with exceptional skills in assisting bloggers and other specializations that necessitate a fantastic writer. One of the most significant parts of being the best is that I have provided excellent service to a large number of clients. With my exceptional abilities, I have amassed a large number of references, allowing me to continue working as a respected and admired writer. As a skilled content writer, I am also a reputable IT writer with the necessary talents to turn papers into exceptional results.
2+ Reviews
10+ Question Solved
Related Book For 
OpenIntro Statistics
ISBN: 9781943450077
4th Edition
Authors: David Diez, Mine Çetinkaya-Rundel, Christopher Barr
Question Posted:
