

The bar plot and the pie chart below show the distribution of pre-existing medical conditions of children
Question:
The bar plot and the pie chart below show the distribution of pre-existing medical conditions of children involved in a study on the optimal duration of antibiotic use in treatment of tracheitis, which is an upper respiratory infection.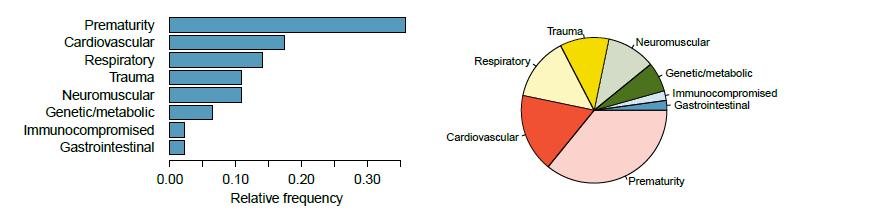
(a) What features are apparent in the bar plot but not in the pie chart?
(b) What features are apparent in the pie chart but not in the bar plot?
(c) Which graph would you prefer to use for displaying these categorical data?
Step by Step Answer:

This question has not been answered yet.
You can Ask your question!
Related Book For 

OpenIntro Statistics
ISBN: 9781943450077
4th Edition
Authors: David Diez, Mine Çetinkaya-Rundel, Christopher Barr
Question Posted:
