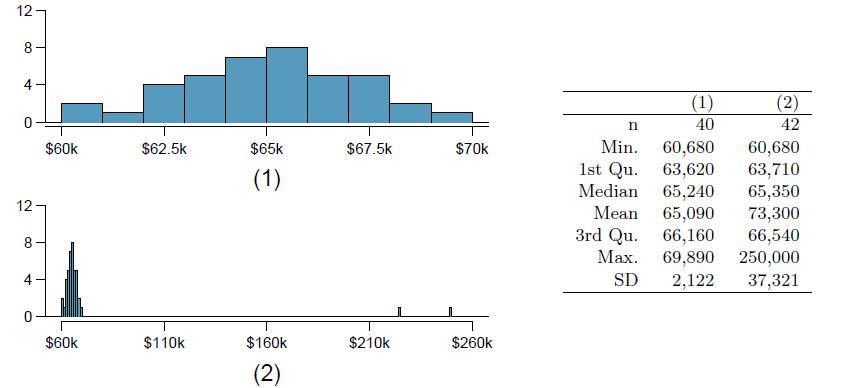
The first histogram below shows the distribution of the yearly incomes of 40 patrons at a college
Question:
The first histogram below shows the distribution of the yearly incomes of 40 patrons at a college coffee shop. Suppose two new people walk into the coffee shop: one making $225,000 and the other $250,000. The second histogram shows the new income distribution. Summary statistics are also provided.
(a) Would the mean or the median best represent what we might think of as a typical income for the 42 patrons at this coffee shop? What does this say about the robustness of the two measures?
(b) Would the standard deviation or the IQR best represent the amount of variability in the incomes of the 42 patrons at this coffee shop? What does this say about the robustness of the two measures?
Step by Step Answer:

OpenIntro Statistics
ISBN: 9781943450077
4th Edition
Authors: David Diez, Mine Çetinkaya-Rundel, Christopher Barr


