

The table provides summary statistics on highway fuel economy of the same 52 cars from Exercise 7.28.
Question:
The table provides summary statistics on highway fuel economy of the same 52 cars from Exercise 7.28. Use these statistics to calculate a 98% confidence interval for the difference between average highway mileage of manual and automatic cars, and interpret this interval in the context of the data.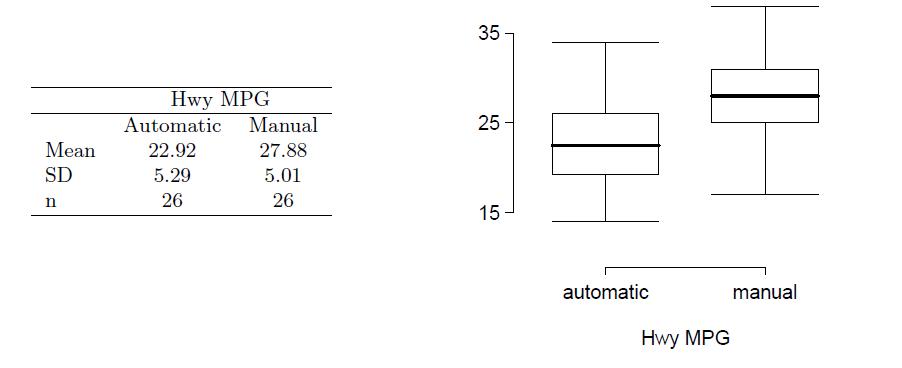
Data from Exercise 7.28
Each year the US Environmental Protection Agency (EPA) releases fuel economy data on cars manufactured in that year. Below are summary statistics on fuel efficiency (in miles/gallon) from random samples of cars with manual and automatic transmissions. Do these data provide strong evidence of a difference between the average fuel efficiency of cars with manual and automatic transmissions in terms of their average city mileage? Assume that conditions for inference are satisfied.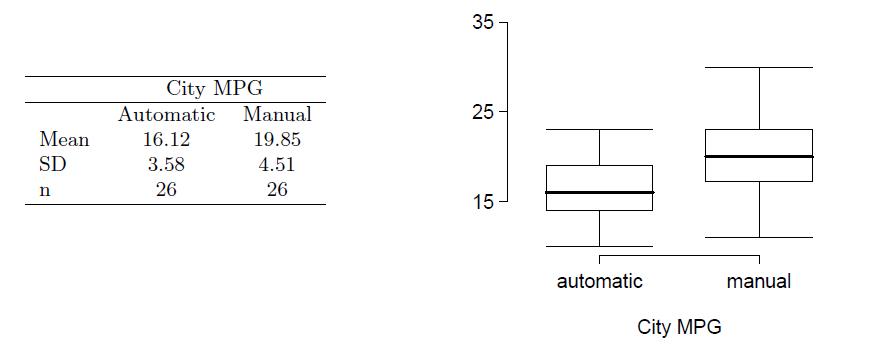
Step by Step Answer:
To calculate a 98 confidence interval for the difference between average highway mileage of manual and automatic cars we will use the means standard d...View the full answer


OpenIntro Statistics
ISBN: 9781943450077
4th Edition
Authors: David Diez, Mine Çetinkaya-Rundel, Christopher Barr
