

The visualization below shows voting patterns in the United States, Canada, and Mexico in the United Nations
Question:
The visualization below shows voting patterns in the United States, Canada, and Mexico in the United Nations General Assembly on a variety of issues. Specifically, for a given year between 1946 and 2015, it displays the percentage of roll calls in which the country voted yes for each issue. This visualization was constructed based on a dataset where each observation is a country / year pair.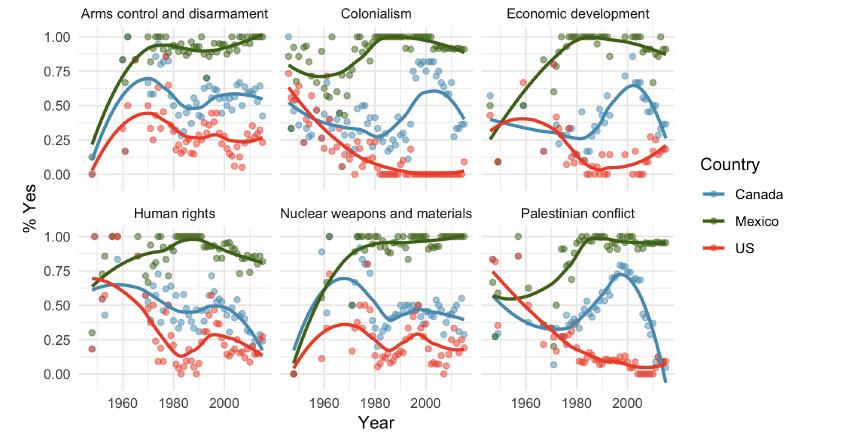
(a) List the variables used in creating this visualization.
(b) Indicate whether each variable in the study is numerical or categorical. If numerical, identify as continuous or discrete. If categorical, indicate if the variable is ordinal.
Fantastic news! We've Found the answer you've been seeking!
Step by Step Answer:

Answered By
Madhur Jain
I have 6 years of rich teaching experience in subjects like Mathematics, Accounting, and Entrance Exams preparation. With my experience, I am able to quickly adapt to the student's level of understanding and make the best use of his time.
I focus on teaching concepts along with the applications and what separates me is the connection I create with my students. I am well qualified for working on complex problems and reaching out to the solutions in minimal time. I was also awarded 'The Best Tutor Award' for 2 consecutive years in my previous job.
Hoping to get to work on some really interesting problems here.
1+ Reviews
10+ Question Solved
Related Book For 
OpenIntro Statistics
ISBN: 9781943450077
4th Edition
Authors: David Diez, Mine Çetinkaya-Rundel, Christopher Barr
Question Posted:
