

Undergraduate students taking an introductory statistics course at Duke University conducted a survey about GPA and major.
Question:
Undergraduate students taking an introductory statistics course at Duke University conducted a survey about GPA and major. The side-by-side box plots show the distribution of GPA among three groups of majors. Also provided is the ANOVA output.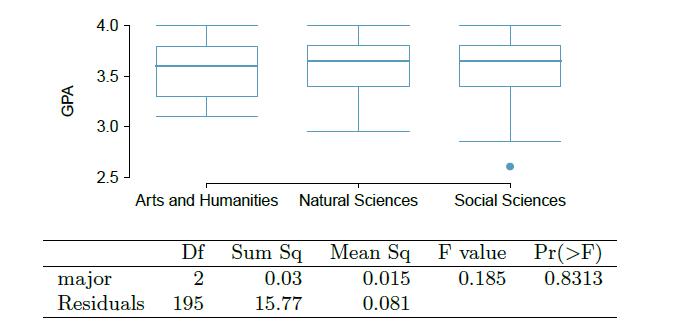
(a) Write the hypotheses for testing for a difference between average GPA across majors.
(b) What is the conclusion of the hypothesis test?
(c) How many students answered these questions on the survey, i.e. what is the sample size?
Fantastic news! We've Found the answer you've been seeking!
Step by Step Answer:
a The hypotheses for testing the difference between average GPA across majors are as follows Null hy...View the full answer

Answered By
Jonas Araujo
I have recently received the degree of PhD. In Physics by the Universidade Federal do Maranhão after spending a term in Durham University, as I have been awarded a scholarship from a Brazilian mobility program. During my PhD. I have performed research mainly in Theoretical Physics and published works in distinguished Journals (check my ORCID: https://orcid.org/0000-0002-4324-1184).
During my BSc. I have been awarded a scholarship to study for a year in the University of Evansville, where I have worked in detection-analysis of photon correlations in the the Photonics Laboratory. There I was a tutor in Electromagnetism, Classical Mechanics and Calculus for most of that year (2012).
I am very dedicated, honest and a fast learner, but most of all, I value a job well done.
1+ Reviews
10+ Question Solved
Related Book For 

OpenIntro Statistics
ISBN: 9781943450077
4th Edition
Authors: David Diez, Mine Çetinkaya-Rundel, Christopher Barr
Question Posted:
