A manager wants to monitor the proportion of red candies present in a five-color candy mix. For
Question:
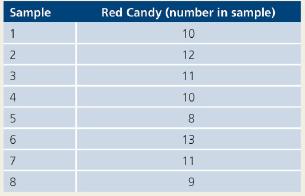
A manager wants to monitor the proportion of red candies present in a five-color candy mix. For 8 hours, the manager has gathered exactly 50 candies every hour, by randomly selecting and emptying one 50-candy bag produced by the the candy mix packaging machine. During this 8-hour shift, the manager was assured the candy color mix was under appropriate control. Examining the eight samples gathered revealed these amounts of red candy:
a. What are the mean and the standard deviation of the natural variation in this sampling process for the proportion of red candy?
b. If the manager uses z = 3.0 to create a p-chart to continue monitoring the propor- tion of red candy in the five-color mix, what will be its upper and lower control limits?
c. Suppose the manager is mistaken in the belief that each bag contains 50 candies. In reality, the number of candies in each bag can vary quite a bit, so the manager has resolved to use a c-chart instead. Assuming the same level of confidence as in part
b, what are the upper and lower control limits of this chart? How does this chart compare to the p-chart in part b?
Step by Step Answer: