

The BOMs for products A & B and data from the inventory records are shown in Figure
Question:
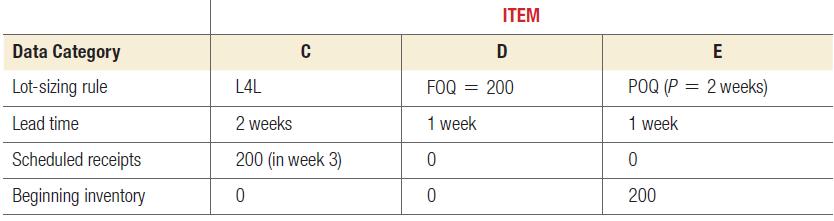
The BOMs for products A & B and data from the inventory records are shown in Figure 11.41. Data from the inventory records are shown in Table 11.10. In the MPS for product A, the MPS start row has 85 units in week 2 and 200 in week 4 and 50 in week 8. In the MPS for product B, the MPS start row has 65 units in week 3 and 50 in week 4 and 50 in week 5 and 75 in week 8.
a. Develop the material requirements plan for the next 8 weeks for items C, D, and E. Note any difficulties you observe in the inventory records.
b. Can the difficulties noted in part (a) be rectified by expediting any Scheduled Receipts?
Fantastic news! We've Found the answer you've been seeking!
Step by Step Answer:
Based on the provided Bill of Materials BOMs for products A and B and the inventory data we can develop the material requirements plan for items C D a...View the full answer

Answered By
Asim farooq
I have done MS finance and expertise in the field of Accounting, finance, cost accounting, security analysis and portfolio management and management, MS office is at my fingertips, I want my client to take advantage of my practical knowledge. I have been mentoring my client on a freelancer website from last two years, Currently I am working in Telecom company as a financial analyst and before that working as an accountant with Pepsi for one year. I also join a nonprofit organization as a finance assistant to my job duties are making payment to client after tax calculation, I have started my professional career from teaching I was teaching to a master's level student for two years in the evening.
My Expert Service
Financial accounting, Financial management, Cost accounting, Human resource management, Business communication and report writing. Financial accounting : • Journal entries • Financial statements including balance sheet, Profit & Loss account, Cash flow statement • Adjustment entries • Ratio analysis • Accounting concepts • Single entry accounting • Double entry accounting • Bills of exchange • Bank reconciliation statements Cost accounting : • Budgeting • Job order costing • Process costing • Cost of goods sold Financial management : • Capital budgeting • Net Present Value (NPV) • Internal Rate of Return (IRR) • Payback period • Discounted cash flows • Financial analysis • Capital assets pricing model • Simple interest, Compound interest & annuities
65+ Reviews
86+ Question Solved
Related Book For 

Operations Management Processes And Supply Chains
ISBN: 9781292409863
13th Global Edition
Authors: Lee Krajewski, Naresh Malhotra, Larry Ritzman
Question Posted:
