

Thompson Industries supply chain manager, Xun Xu, wishes to better understand the quality and on-time performance of
Question:
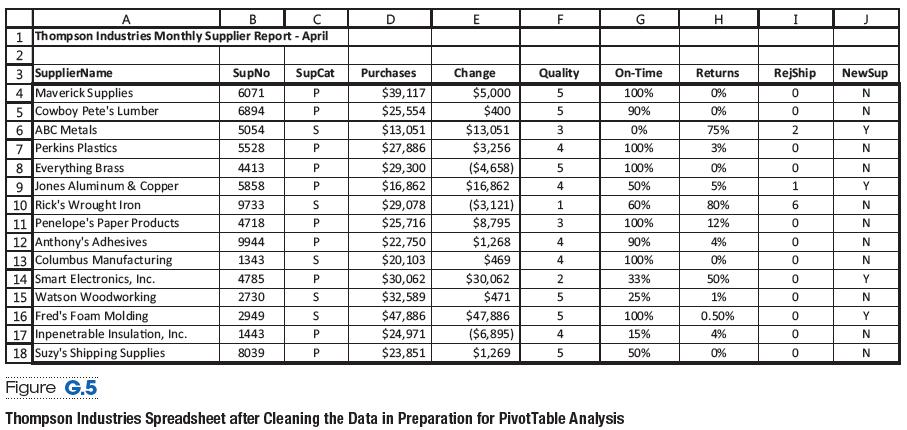
Thompson Industries’ supply chain manager, Xun Xu, wishes to better understand the quality and on-time performance of his supply base. He suggests that you, using the data in Figure G.5, use Excel to create a PivotTable that displays the number of suppliers, grouped by quality level (sorted largest-to-smallest), and subtotaled by percentage of on-time shipments (but only for suppliers with more than 50% on-time shipments). Show values as % of Column Total. What value appears in the cell for 100% on-time shipping percentage and quality level of 3?
Figure G.5
Fantastic news! We've Found the answer you've been seeking!
Step by Step Answer:
ANSWER We can tell from the aforementioned data analysis ...View the full answer

Answered By
Aketch Cindy Sunday
I am a certified tutor with over two years of experience tutoring . I have a passion for helping students learn and grow, and I firmly believe that every student has the potential to be successful. I have a wide range of experience working with students of all ages and abilities, and I am confident that I can help students succeed in school.
I have experience working with students who have a wide range of abilities. I have also worked with gifted and talented students, and I am familiar with a variety of enrichment and acceleration strategies.
I am a patient and supportive tutor who is dedicated to helping my students reach their full potential. Thank you for your time and consideration.
0 Reviews
10+ Question Solved
Related Book For 
Operations Management Sustainability And Supply Chain Management
ISBN: 9780135173626
13th Edition
Authors: Jay Heizer, Barry Render, Chuck Munson
Question Posted:
