

Table F.6 gives the sales in millions of dollars for a department store. Analyze the data from
Question:
Table F.6 gives the sales in millions of dollars for a department store. Analyze the data from the standpoint of the applicability of the moving average technique.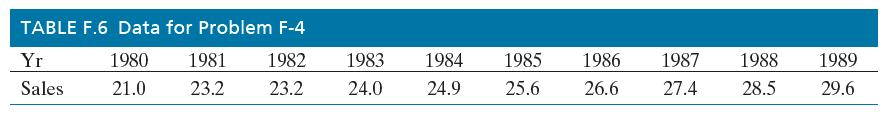
Fantastic news! We've Found the answer you've been seeking!
Step by Step Answer:
Linear trend Use small n ...View the full answer

Answered By
Rakesh Rajbansi
I am a professional academic content writer with a never-ending craving for knowledge and wisdom. Just like a pen being mightier than a sword, I took writing as a career to bring the best out of me. This very craving for knowledge has helped me to establish myself as a content writer.
0 Reviews
10+ Question Solved
Related Book For 

Question Posted:
