

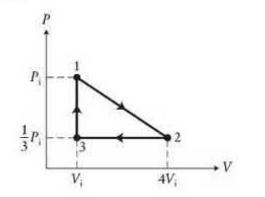
An ideal gas undergoes the process represented by the (P V) diagram of Figure P20.33, where the
Question:
An ideal gas undergoes the process represented by the \(P V\) diagram of Figure P20.33, where the gas is in state 1 when the process begins and again in state 1 at the end of the process. Calculate the work done on the gas as a function of the initial pressure and volume.
Data from Figure P20.33
Fantastic news! We've Found the answer you've been seeking!
Step by Step Answer:

Answered By
Utsab mitra
I have the expertise to deliver these subjects to college and higher-level students. The services would involve only solving assignments, homework help, and others.
I have experience in delivering these subjects for the last 6 years on a freelancing basis in different companies around the globe. I am CMA certified and CGMA UK. I have professional experience of 18 years in the industry involved in the manufacturing company and IT implementation experience of over 12 years.
I have delivered this help to students effortlessly, which is essential to give the students a good grade in their studies.
2+ Reviews
10+ Question Solved
Related Book For 
Question Posted:
