

The diagram shows a sketch of the graph y = f(x). The curve has a maximum at
Question:
The diagram shows a sketch of the graph y = f(x). The curve has a maximum at the point A(−1, 4) and crosses the axes at the points (0, 3) and (−2, 0).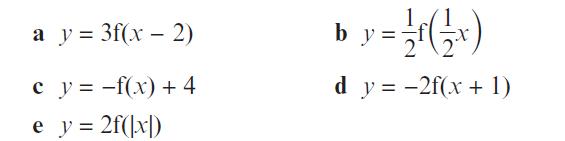
For each graph, find, where possible, the coordinates of the maximum or minimum and the coordinates of the intersection points with the axes.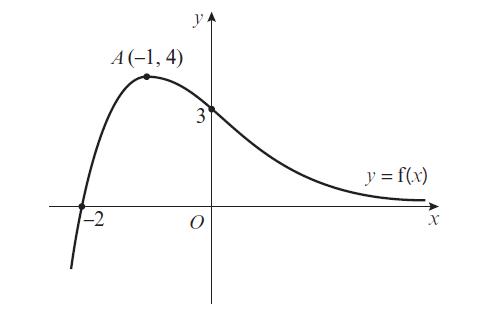
Fantastic news! We've Found the answer you've been seeking!
Step by Step Answer:
B 1 12 f 1...View the full answer

Answered By
Muhammad Umair
I have done job as Embedded System Engineer for just four months but after it i have decided to open my own lab and to work on projects that i can launch my own product in market. I work on different softwares like Proteus, Mikroc to program Embedded Systems. My basic work is on Embedded Systems. I have skills in Autocad, Proteus, C++, C programming and i love to share these skills to other to enhance my knowledge too.
1+ Reviews
10+ Question Solved
Related Book For 

Pearson Edexcel A Level Mathematics Pure Mathematics Year 2
ISBN: 9781292183404
1st Edition
Authors: Greg Attwood, Jack Barraclough, Ian Bettison, David Goldberg, Alistair Macpherson, Joe Petran
Question Posted:
