

The diagram shows a sketch of the graph y = f(x). The curve passes through the origin
Question:
The diagram shows a sketch of the graph y = f(x). The curve passes through the origin O, the point A(−2, −2) and the point B(3, 4). On separate axes, sketch the graphs of:
In each case find the coordinates of the images of the points O, A and B.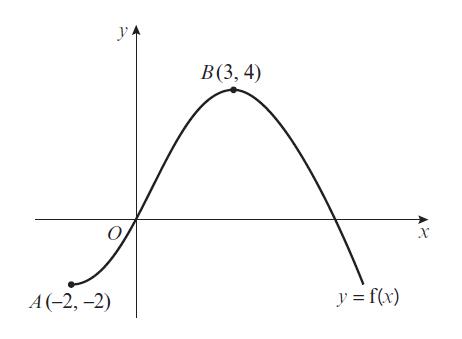
Fantastic news! We've Found the answer you've been seeking!
Step by Step Answer:
a 24 0 2 YA 22 HA 10 ...View the full answer

Answered By
Sigei Kipngeno
I am a professional writer with more than 2 years of writing experience. I will always deliver a grade A paper with zero plagiarism . Thanks in advance.
175+ Reviews
311+ Question Solved
Related Book For 

Pearson Edexcel A Level Mathematics Pure Mathematics Year 2
ISBN: 9781292183404
1st Edition
Authors: Greg Attwood, Jack Barraclough, Ian Bettison, David Goldberg, Alistair Macpherson, Joe Petran
Question Posted:
