

Exercises 6 and 12, you described the relationship between fat (in grams) and the number of calories
Question:
Exercises 6 and 12, you described the relationship between fat (in grams) and the number of calories in products sold at Starbucks. The scatterplot shows this relationship, along with two regression lines. The regression line for the food products (blue squares) is ŷ = 170 + 11.8x . The regression line for the drink products (black dots) is ŷ = 88 + 24.5x.
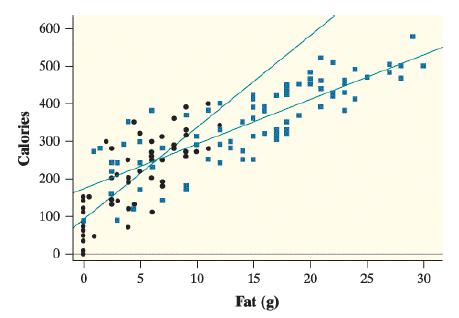
a. How do the regression lines compare?
b. How many more calories do you expect to find in a food item with 5 grams of fat compared to a drink item with 5 grams of fat?
Exercises 6 and 12
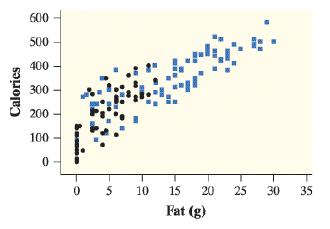
How do the nutritional characteristics of food products differ from drink products at Starbucks? The scatterplot shown here enhances the scatterplot from Exercise 6 by plotting the food products with blue squares. How are the relationships between fat and calories the same for the two types of products? How are the relationships different?
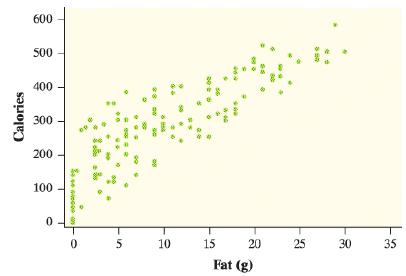
The scatterplot shows the relationship between the amount of fat (in grams) and number of calories in products sold at Starbucks. Describe the relationship between fat and calories for these products.
Step by Step Answer:
PART A For food products we are given the regression line y 170 118x This means for a unit increase ...View the full answer


