

In Exercises 5 and 11, you described the relationship between height (in inches) and weight (in pounds)
Question:
In Exercises 5 and 11, you described the relationship between height (in inches) and weight (in pounds) for Olympic track and field athletes. The scatterplot shows this relationship, along with two regression lines. The regression line for the shotput, hammer throw, and discus throw athletes (blue squares) is ŷ = −115+5.13x . The regression line for the remaining athletes (black dots) is ŷ = −297+6.41x.
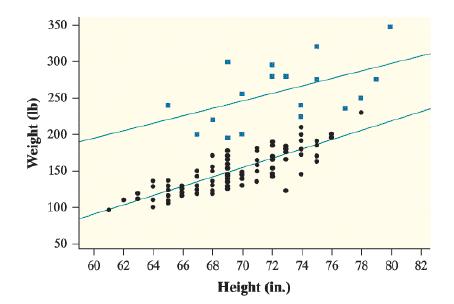
a. How do the regression lines compare?
b. How much more do you expect a 72-inch discus thrower to weigh than a 72-inch sprinter?
Exercises 5 and 11
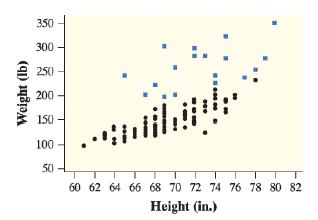
Athletes who participate in the shot put, discus throw, and hammer throw tend to have different physical characteristics than other track and field athletes. The scatterplot shown here enhances the scatterplot from Exercise 5 by plotting these athletes with blue squares. How are the relationships between height and weight the same for the two groups of athletes? How are the relationships different?
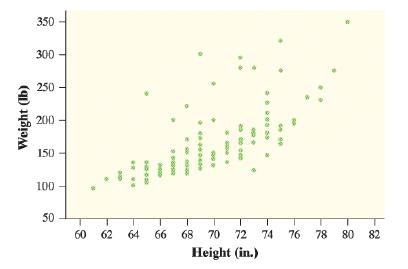
The scatterplot shows the relationship between height (in inches) and weight (in pounds) for the members of the United States 2016 Olympic Track and Field team. Describe the relationship between height and weight for these athletes.
Step by Step Answer:
a The regression lines are nearly parallel but the y intercept is much greater fo...View the full answer


