Here is a pie chart prepared by the Census Bureau to show the origin of the more
Question:
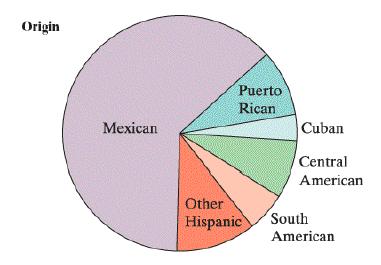
Here is a pie chart prepared by the Census Bureau to show the origin of the more than 50 million Hispanics in the United States in 2010. About what percent of Hispanics are Mexican? Puerto Rican?
Transcribed Image Text:
Origin Puerto Rican Мехican Cuban Central American Other Hispanic South American
Fantastic news! We've Found the answer you've been seeking!
Step by Step Answer:
Related Book For
Question Posted:
Students also viewed these Mathematics questions
-
The U.S. Census Bureau divides the states in the United States into four regions: Northeast (NE), Midwest (MW), South (SO), and West (WE). The following table gives the region of each of the 50...
-
Shown here is an Excel-produced pie chart representing physician specialties. What does the chart tell you about the various specialties? Physician Specialties Psychiatry Anesthesiology Family...
-
Figure 2.1 shows a bar chart and a pie chart for how people paid for purchases and other transactions (see page 47). a. Create an exploded pie chart, a cone chart, or a pyramid chart that shows how...
-
using System; using System.Collections.Generic; using System.ComponentModel; using System.Data; using System.Drawing; using System.Linq; using System.Text; using System.Threading.Tasks; using...
-
An experiment was conducted to compare the response times for two different stimuli. To remove natural person-to person variability in the responses, both stimuli were presented to each of nine...
-
Consider the following class Method Trace: What does the following code print out? public class MethodTrace { public MethodTrace ( ) { } public void sayCheese ( ) { } System.out.print ("Cheese");...
-
Frequently, sales managers use contests and recognition rewards to motivate the sales force. If sales managers understand salesperson performance, why is it necessary to employ these additional...
-
BrandCo currently has 50 million shares outstanding. If BrandCos shares are trading at $19.16 per share, what is the companys market capitalization (value of equity)? Assuming the market value of...
-
The routing tables for routers R1, R2, R3 & R4 are given. Draw the network configuration with all these routers. Indicate the next-hop addresses in the figure. R1: Network Mask Address Next-Hop...
-
A paper recycling company converts newspaper, mixed paper, white office paper, and cardboard into pulp for newsprint, packaging paper, and print stock quality paper. The following table summarizes...
-
The most popular colors for cars and light trucks change over time. Silver advanced past green in 2000 to become the most popular color worldwide, then gave way to shades of white in 2007. Here is a...
-
Students in a high school statistics class were given data about the main method of transportation to school for a group of 30 students. They produced the pictograph shown. Explain how this graph is...
-
For the part shown, answer the following questions with regard to the hole. (a) What are the maximum and minimum diameters allowed for the hole? (b) What is the effect of the position tolerance of...
-
Consider the following rival companies. Why are they all market leaders? Compare their positioning, pricing, and value-added strategies. i. Apple and Samsung ii. PlayStation and Xbox iii. Nike and...
-
Write a datalow VHDL description for the circuit in Figure 2-43 by using the Boolean equation for the output F. Figure 2-43
-
This problem is based on the solution in Problem 8.4-3. Suppose that in Fig. P8.4-3, the sensor gain \(H=0.04\) is moved back to the feedback path. What effect does this have on the percent...
-
Making use of the Peng-Robinson equation, calculate H, S, U, and V for 1 gmol of 1,3-butadiene when it is compressed from 25 bar and 400 K to 125 bar and 550 K.
-
Repeat Problem 9.58 for a closed feedwater heater where the extraction steam is pumped to the boiler pressure before being combined with the condenser feedwater, as shown in Fig. 9.18. Assume...
-
You are the manager of a U.S. firm where the majority of corporate executives are female. Your firm is very proud of the numerous accolades and awards it has received for its efforts and success in...
-
Explain how the graph of each function can be obtained from the graph of y = 1/x or y = 1/x 2 . Then graph f and give the (a) Domain (b) Range. Determine the largest open intervals of the domain over...
-
A researcher believes that family size has increased in the past decade in comparison to the previous decadethat is, people are now having more children than they were before. What are the null and...
-
What are the appropriate H0 and Ha for each of the following research studies? In addition, note whether the hypothesis test is one- or two-tailed. a. A study in which researchers want to test...
-
Assume that each of the following conclusions represents an error in hypothesis testing. Indicate whether each of the statements is a Type I or II error. a. Based on the data, the null hypothesis is...
-
Question: Part One: Memo Write an analysis of the impact of tax laws and incentives as demonstrated in this current years tax return. Specifically, you must address the following: Explain the...
-
From the following ledger balances, prepare a trial balance for the Cheyenne Corp. at June 3 0 , 2 0 2 2 . All account balances are normal.Accounts Payable $ 1 0 , 0 0 0 , Cash $ 7 , 4 0 0 , Common...
-
Kathy is mixing fruit punch in a 32-cup punch bowl for a party. She plans to add at least 20 cups of fruit juice to the bowl before adding ginger ale. Identify the graph that represents the amounts...
Study smarter with the SolutionInn App