

According to Figures 1 and 2, the difference between Peak C and Peak D erosion rates could
Question:
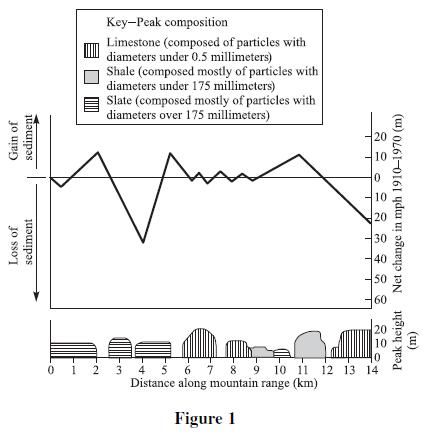
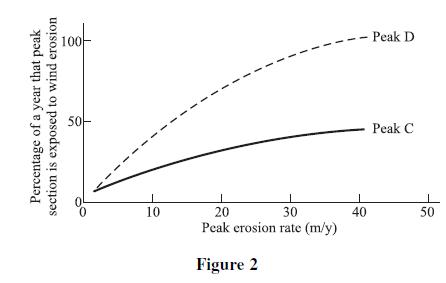
According to Figures 1 and 2, the difference between Peak C and Peak D erosion rates could best be explained as a difference in the:
F. Heights of the two peaks.
G. Force of the winds on the two peaks.
H. Composition of the two peaks.
J. Annual snowfall on the two peaks
Fantastic news! We've Found the answer you've been seeking!
Step by Step Answer:
The best answer is F Figure 2 shows that Peak D is ex...View the full answer

Answered By
Mugdha Sisodiya
My self Mugdha Sisodiya from Chhattisgarh India. I have completed my Bachelors degree in 2015 and My Master in Commerce degree in 2016. I am having expertise in Management, Cost and Finance Accounts. Further I have completed my Chartered Accountant and working as a Professional.
Since 2012 I am providing home tutions.
2+ Reviews
10+ Question Solved
Related Book For 

Question Posted:
