

Which of the following graphs best represents the relationship between time elapsed and saturation of the rocks
Question:
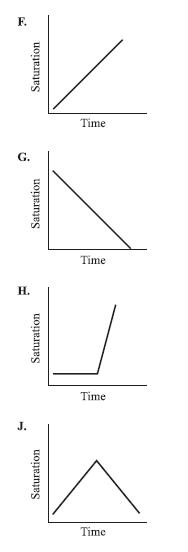
Which of the following graphs best represents the relationship between time elapsed and saturation of the rocks observed in Experiment 1?
Experiment 1
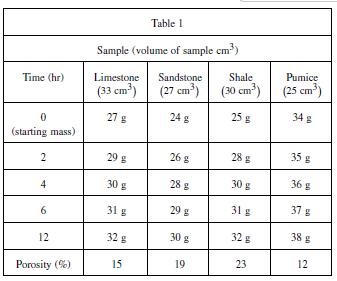
In a laboratory, a scientist wanted to determine the porosity of 4 samples of different rocks. The scientist recorded the mass of the rock samples prior to the experiment. To measure porosity, the samples were soaked in water and the mass of the samples was recorded periodically. A highly porous rock would have a significant increase in mass the longer it soaked in water, eventually reaching the point at which it could no longer absorb any more water (saturation point). The data was recorded in Table 1.
Fantastic news! We've Found the answer you've been seeking!
Step by Step Answer:
The best answer is F The data in Table 1 shows that as time increases each of th...View the full answer

Answered By
Stacy kosgei
I offer quality, original and timely services; Highly credible and void of plagiarism. Your success is my pleasure.
2+ Reviews
10+ Question Solved
Related Book For 

Question Posted:
