

The given graph shows the temperature T in F at Davis, CA, on April 18, 2008, between
Question:
The given graph shows the temperature T in °F at Davis, CA, on April 18, 2008, between 6 a.m. and 6 p.m.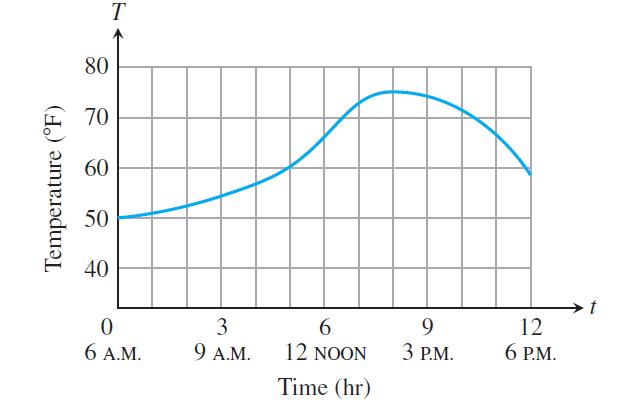
a. Estimate the rate of temperature change at the times
i) 7 a.m.
ii) 9 a.m.
iii) 2 p.m.
iv) 4 p.m.
b. At what time does the temperature increase most rapidly? Decrease most rapidly? What is the rate for each of those times?
c. Use the graphical technique of Example 3 to graph the derivative of temperature T versus time t.
Example 3
Graph the derivative of the function y = ƒ(x) in Figure 3.6a.
In Figure 3.6a.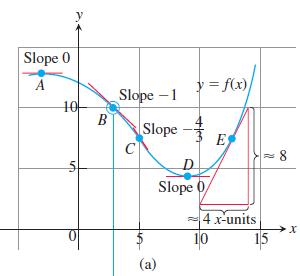
Fantastic news! We've Found the answer you've been seeking!
Step by Step Answer:
a i 15 Fhr ii 29 Fhr iii 0 ...View the full answer

Answered By
Muhammad Umair
I have done job as Embedded System Engineer for just four months but after it i have decided to open my own lab and to work on projects that i can launch my own product in market. I work on different softwares like Proteus, Mikroc to program Embedded Systems. My basic work is on Embedded Systems. I have skills in Autocad, Proteus, C++, C programming and i love to share these skills to other to enhance my knowledge too.
1+ Reviews
10+ Question Solved
Related Book For 
Thomas Calculus Early Transcendentals
ISBN: 9780321884077
13th Edition
Authors: Joel R Hass, Christopher E Heil, Maurice D Weir
Question Posted:
