

The following graph shows three indifference curves and the accompanying budget constraints for products X and Y.
Question:
The following graph shows three indifference curves and the accompanying budget constraints for products X and Y. The graph represents the price of product X falling from P1x to P2x and then to P3x. Explain how a demand curve for product X can be derived from this graph and draw a graph showing the demand curve for product X.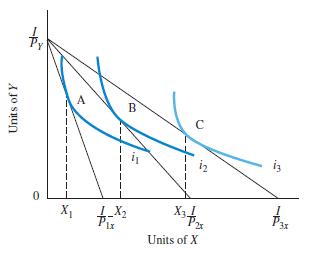
Fantastic news! We've Found the answer you've been seeking!
Step by Step Answer:
The graph you provided illustrates indifference curves and budget constraints for products X and Y L...View the full answer

Answered By
Gaurav Soni
Teaching was always an area where I can pursue my passion. I used to teach my friends and junior during my school and college life. After completing my professional qualification (chartered accountancy) and before joining my job, I also joined an organization for teaching and guidance to my juniors. I had also written some articles during my internship which later got published. apart from that, I have also given some presentations on certain amendments/complex issues in various forms.
Linkedin profile link:
https://www.linkedin.com/in/gaurav-soni-38067110a
7+ Reviews
13+ Question Solved
Related Book For 

Principles Of Economics
ISBN: 9781292294698
13th Global Edition
Authors: Karl E. Case, Ray C. Fair, Sharon E. Oster
Question Posted:
