

Carmen has $84 to spend on California rolls and eel sashimi, and the data in the following
Question:
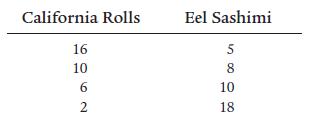
Carmen has $84 to spend on California rolls and eel sashimi, and the data in the following table represents an indifference curve for these two products. If California rolls are $4.00 each and eel sashimi is $6.00 each, draw a graph showing Carmen’s indifference curve and her budget constraint, putting California rolls on the vertical axis and eel sashimi on the horizontal axis.
What combination of California rolls and eel sashimi will Carmen purchase? Will this combination maximize Carmen’s total utility? Explain.
Fantastic news! We've Found the answer you've been seeking!
Step by Step Answer:
To draw Carmens indifference curve and her budget constraint we need to follow these steps Determine ...View the full answer

Answered By
Sigei Kipngeno
I am a professional writer with more than 2 years of writing experience. I will always deliver a grade A paper with zero plagiarism . Thanks in advance.
175+ Reviews
311+ Question Solved
Related Book For 
Principles Of Economics
ISBN: 9781292294698
13th Global Edition
Authors: Karl E. Case, Ray C. Fair, Sharon E. Oster
Question Posted:
