

The following table represents data for Randles Candles. Draw a graph showing the total product, marginal product
Question:
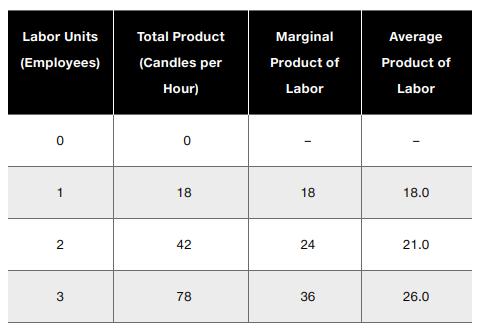
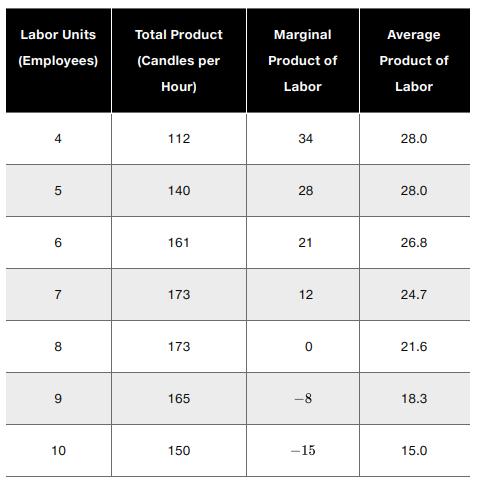
The following table represents data for Randle’s Candles. Draw a graph showing the total product, marginal product of labor, and average product of labor. Identify where increasing returns, diminishing returns, and negative returns set in on the total product curve.
Step by Step Answer:

This question has not been answered yet.
You can Ask your question!
Related Book For 

Mylab Economics With Pearson Access Code For Principles Of Microeconomics
ISBN: 9780135197141,9780135197103
13th Edition
Authors: Karl E. Case; Ray C. Fair; Sharon E. Oster
Question Posted:
