

Suppose the expenditure figures in Problem 1 were modified as follows (figures are in thousands). Draw this
Question:
Suppose the expenditure figures in Problem 1 were modified as follows (figures are in thousands).
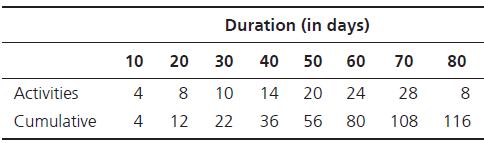
Draw this S-curve. What does the new S-curve diagram represent? How would you explain the reason for the different, non-S-shape of the curve?
Problem 1
Why is the generic four-stage control cycle useful for understanding how to monitor and control projects?
Step by Step Answer:

This question has not been answered yet.
You can Ask your question!
Related Book For 

Project Management Achieving Competitive Advantage
ISBN: 9781292269146
5th Global Edition
Authors: Jeffrey K.Pinto
Question Posted:
