

Figure 2.4 shows a bar chart and a pie chart for what devices millennials used to watch
Question:
Figure 2.4 shows a bar chart and a pie chart for what devices millennials used to watch movies/TV shows.
a. Create an exploded pie chart, a cone chart, or a pyramid chart that shows how people paid for purchases and other transactions.
b. Which graphs either seen in Figure 2.4 or created in (a), do you prefer? Explain.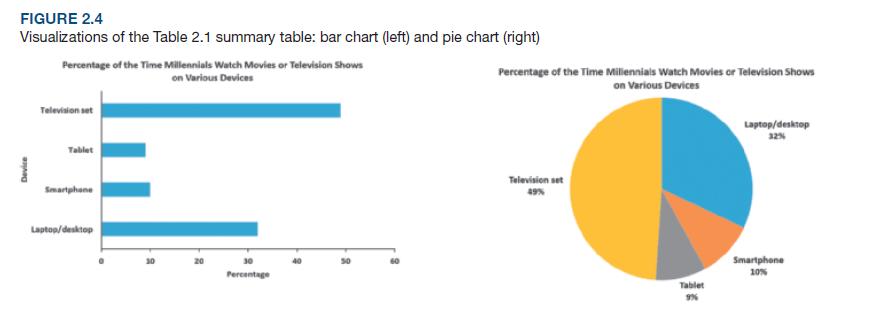
Fantastic news! We've Found the answer you've been seeking!
Step by Step Answer:

Answered By
Utsab mitra
I have the expertise to deliver these subjects to college and higher-level students. The services would involve only solving assignments, homework help, and others.
I have experience in delivering these subjects for the last 6 years on a freelancing basis in different companies around the globe. I am CMA certified and CGMA UK. I have professional experience of 18 years in the industry involved in the manufacturing company and IT implementation experience of over 12 years.
I have delivered this help to students effortlessly, which is essential to give the students a good grade in their studies.
2+ Reviews
10+ Question Solved
Related Book For 

Public Finance An International Perspective
ISBN: 9789814365048
1st Edition
Authors: Joshua E. Greene
Question Posted:
