

05 Guesion No: 02 a). Briefly explain the terms diameter and 90% effective diameter in the...
Fantastic news! We've Found the answer you've been seeking!
Question:
Transcribed Image Text:
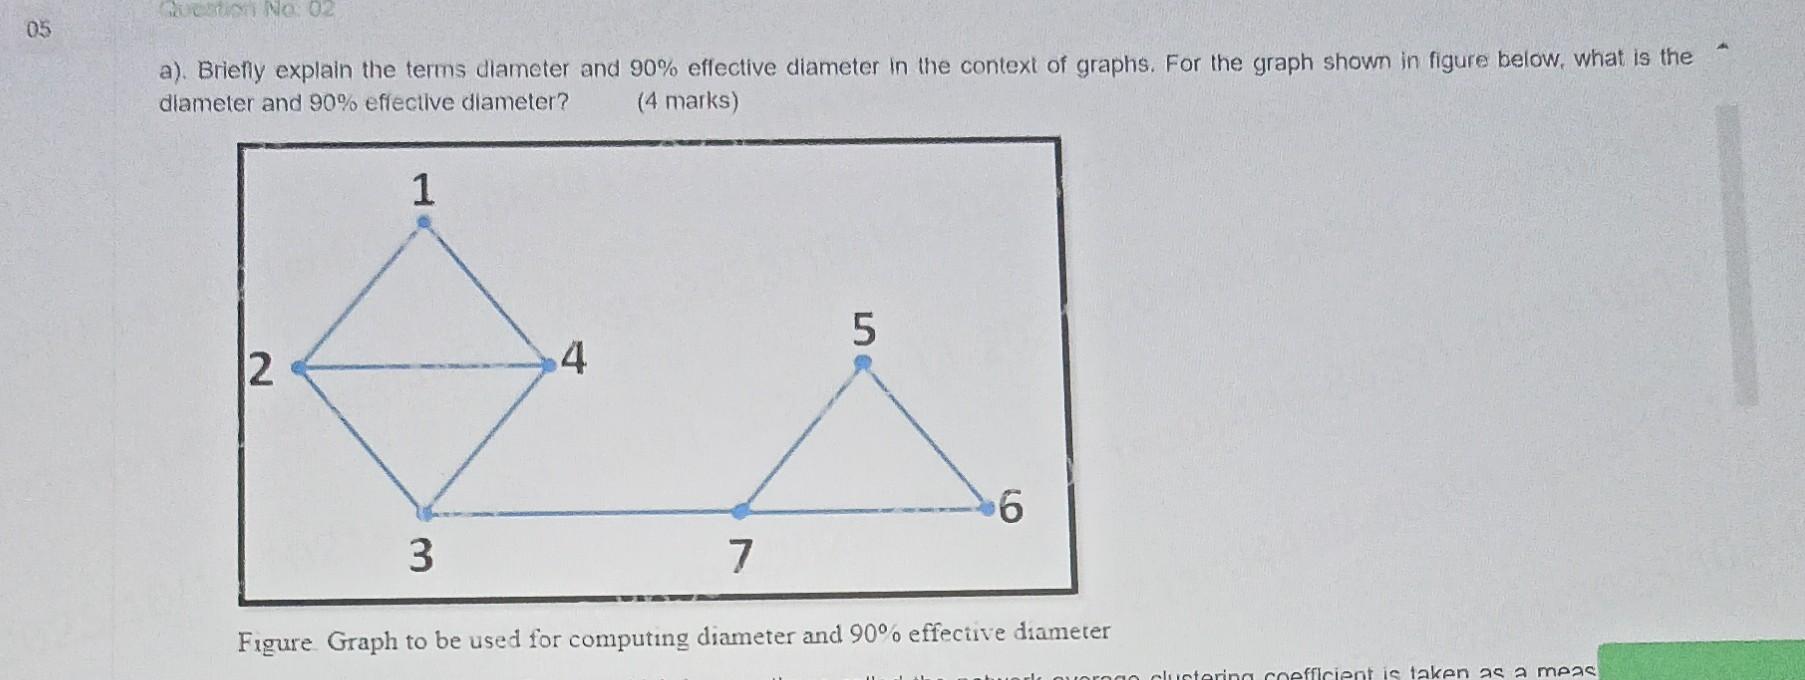
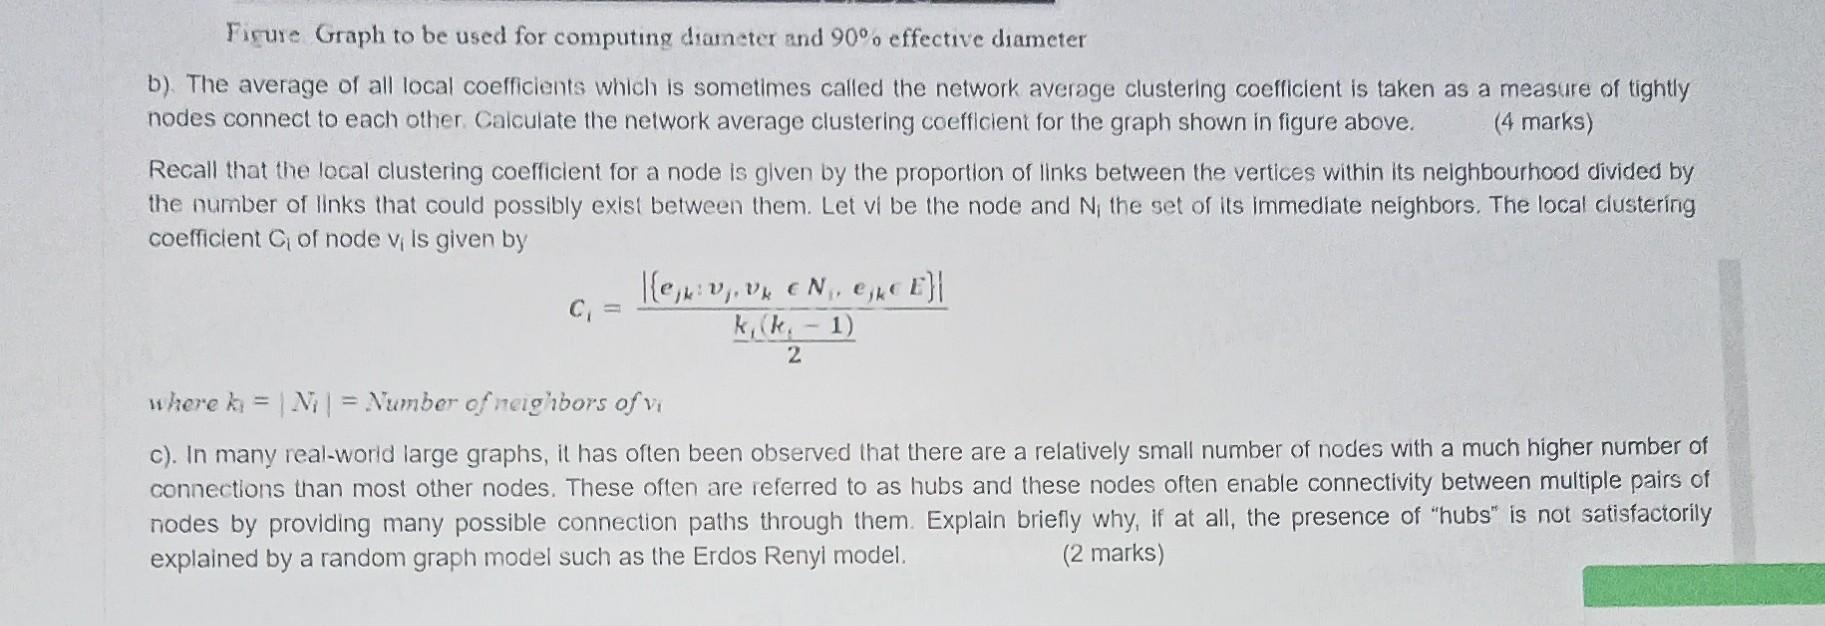
05 Guesion No: 02 a). Briefly explain the terms diameter and 90% effective diameter in the context of graphs. For the graph shown in figure below, what is the diameter and 90% effective diameter? (4 marks) 1 2 3 4 5 6 7 Figure Graph to be used for computing diameter and 90% effective diameter clustering .coefficient is taken as a meas Figure Graph to be used for computing diameter and 90% effective diameter b). The average of all local coefficients which is sometimes called the network average clustering coefficient is taken as a measure of tightly nodes connect to each other. Calculate the network average clustering coefficient for the graph shown in figure above. (4 marks) Recall that the local clustering coefficient for a node is given by the proportion of links between the vertices within its neighbourhood divided by the number of links that could possibly exist between them. Let vi be the node and N, the set of its immediate neighbors. The local clustering coefficient C of node v, is given by C₁ [e₁v₁, v € N₁, €₁ € E}| 1) k, (k 2 where k = | N₁ | Number of neighbors of vi c). In many real-world large graphs, it has often been observed that there are a relatively small number of nodes with a much higher number of connections than most other nodes. These often are referred to as hubs and these nodes often enable connectivity between multiple pairs of nodes by providing many possible connection paths through them. Explain briefly why, if at all, the presence of "hubs" is not satisfactorily explained by a random graph model such as the Erdos Renyi model. (2 marks) 05 Gucsuon No: 02 a). Briefly explain the terms diameter and 90% effective diameter in the context of graphs. For the graph shown in figure below, what is the diameter and 90% effective diameter? (4 marks) 1 2 3 4 5 6 7 Figure Graph to be used for computing diameter and 90% effective diameter clustering. coefficient is taken as a meas Figure Graph to be used for computing diameter and 90% effective diameter b). The average of all local coefficients which is sometimes called the network average clustering coefficient is taken as a measure of tightly nodes connect to each other. Calculate the network average clustering coefficient for the graph shown in figure above. (4 marks) Recall that the local clustering coefficient for a node is given by the proportion of links between the vertices within its neighbourhood divided by the number of links that could possibly exist between them. Let vi be the node and N, the set of its immediate neighbors. The local clustering coefficient C of node v, is given by C₁ [e₁v₁, v k, (k 2 N₁, €₁ € E}| 1) where k = | N₁ | = Number of neighbors of vi c). In many real-world large graphs, it has often been observed that there are a relatively small number of nodes with a much higher number of connections than most other nodes. These often are referred to as hubs and these nodes often enable connectivity between multiple pairs of nodes by providing many possible connection paths through them. Explain briefly why, if at all, the presence of "hubs" is not satisfactorily explained by a random graph model such as the Erdos Renyi model. (2 marks) 05 Guesion No: 02 a). Briefly explain the terms diameter and 90% effective diameter in the context of graphs. For the graph shown in figure below, what is the diameter and 90% effective diameter? (4 marks) 1 2 3 4 5 6 7 Figure Graph to be used for computing diameter and 90% effective diameter clustering .coefficient is taken as a meas Figure Graph to be used for computing diameter and 90% effective diameter b). The average of all local coefficients which is sometimes called the network average clustering coefficient is taken as a measure of tightly nodes connect to each other. Calculate the network average clustering coefficient for the graph shown in figure above. (4 marks) Recall that the local clustering coefficient for a node is given by the proportion of links between the vertices within its neighbourhood divided by the number of links that could possibly exist between them. Let vi be the node and N, the set of its immediate neighbors. The local clustering coefficient C of node v, is given by C₁ [e₁v₁, v € N₁, €₁ € E}| 1) k, (k 2 where k = | N₁ | Number of neighbors of vi c). In many real-world large graphs, it has often been observed that there are a relatively small number of nodes with a much higher number of connections than most other nodes. These often are referred to as hubs and these nodes often enable connectivity between multiple pairs of nodes by providing many possible connection paths through them. Explain briefly why, if at all, the presence of "hubs" is not satisfactorily explained by a random graph model such as the Erdos Renyi model. (2 marks) 05 Gucsuon No: 02 a). Briefly explain the terms diameter and 90% effective diameter in the context of graphs. For the graph shown in figure below, what is the diameter and 90% effective diameter? (4 marks) 1 2 3 4 5 6 7 Figure Graph to be used for computing diameter and 90% effective diameter clustering. coefficient is taken as a meas Figure Graph to be used for computing diameter and 90% effective diameter b). The average of all local coefficients which is sometimes called the network average clustering coefficient is taken as a measure of tightly nodes connect to each other. Calculate the network average clustering coefficient for the graph shown in figure above. (4 marks) Recall that the local clustering coefficient for a node is given by the proportion of links between the vertices within its neighbourhood divided by the number of links that could possibly exist between them. Let vi be the node and N, the set of its immediate neighbors. The local clustering coefficient C of node v, is given by C₁ [e₁v₁, v k, (k 2 N₁, €₁ € E}| 1) where k = | N₁ | = Number of neighbors of vi c). In many real-world large graphs, it has often been observed that there are a relatively small number of nodes with a much higher number of connections than most other nodes. These often are referred to as hubs and these nodes often enable connectivity between multiple pairs of nodes by providing many possible connection paths through them. Explain briefly why, if at all, the presence of "hubs" is not satisfactorily explained by a random graph model such as the Erdos Renyi model. (2 marks)
Expert Answer:
Answer rating: 100% (QA)
Answer A Diameter in graph theory It is the maximum distance between the pair o... View the full answer

Related Book For 

Posted Date:
Students also viewed these programming questions
-
The graph below displays the distribution of word lengths (number of letters) in the Gettysburg Address, which you explored in Exploration 2.1A. a. Describe the shape of this distribution. b. Based...
-
Find an example of data/claims related to your interests or your work. https://www.wral.com/survey-finds-7-of-north-carolina-teachers-plan-to-quit-after-this-school-year/20319953/ required Summarize...
-
Delta Catfish Company has taken a position in its tax return to claim a tax credit of $10 million (direct reduction in taxes payable) and has determined that its sustainability is more likely than...
-
What do barriers to entry have to do with the extent of competition in an industry? What is the most important reason that some industries, such as music streaming, are dominated by just a few firms?
-
Draw a Lewis structure for each of the following molecules: (a) Methanol, CH 3 OH (b) Vinyl chloride, H 2 CPCHCl, the molecule from which PVC plastics are made (c) Acrylonitrile, H 2 CPCHCN, the...
-
The accountant of Pushpa Engineering Company Ltd. has prepared the following trial balance of the company as on 31st March, 2006. Further information 1. Authorised equity share capital of the company...
-
Sultan, Inc. manufactures goods to special order and uses a job order cost system. During its first month of operations, the following selected transactions took place: a. Materials purchased on...
-
Reliability and validity are cornerstone concepts in quantitative research, while credibility plays a similar foundational role in qualitative research. Understanding these concepts helps to assess...
-
Draw a decision tree for the problem of deciding whether to move forward at a road intersection, given that the light has just turned green.
-
Intel Corporation (INTC) is currently trading at $60 per share, and is expected to either appreciate to $75 per share or depreciate to $50 per share in one year's time. You are considering purchasing...
-
Describe, from your perspective, the essential role of the Senior Financial Analyst. Explain the roles' impact on the health care industry. Outline ways in which you can apply one of the discussed...
-
Identify and assess the current competitive generic strategy of Marriott International and theconditions that created that strategy (internal and/or external). Identify any changes in strategy that...
-
3. Large companies, such as General Motors Corporation, usually have a multidivisional organizational structure. Describe two distinct advantages which this type organizational structure has over the...
-
Simplify: -5252 +545-328-15 (entry tip: to type type "5sqrt(3x)" - no quotes) Add Work Calculator Check Answer
-
If the exchange rate between the Canadian dollar and the Pound is 1 Canadian dollar = 0.71 Pounds, according to the law of one price, a baseball cap that retails for 17 Canadian dollars in Toronto...
-
Frank has invested in a segregated fund that is generally considered lower risk and the fund pays him regular income. The income he receives from the fund is primarily interest income, but he also...
-
Eleni Cabinet Company sold 2,200 cabinets during 2011 at $160 per cabinet. Its beginning inventory on January 1 was 130 cabinets at $56. Purchases made during the year were as follows: February . 225...
-
The following data give the ages (in years) of all six members of a family. a. Let x denote the age of a member of this family. Write the population distribution of x. b. List all the possible...
-
In March 2012, the Gallup-Healthways Well-Being Index (www.gallup.com/poll/153251/ No-Major-Change-Americans-Exercise-Habits-2011.aspx) reported on exercise habits of Americans. Specifically, they...
-
Consider the null hypothesis H0: = 625. Suppose that a random sample of 29 observations is taken from a normally distributed population with = 32. Using a significance level of .01, show the...
-
Consider the problem min x1+x2 s.t. h(x) = x2 x3 = 0, - - h2(x) = x2 = 0,
-
Prove that the dual function of Eq. (16.12) is concave Data From Equation (16.12) 19S See https://www.gams.com/ 20 See http://cvxr.com/
-
Consider the quadratic programming problem 1-Solve the problem using KKT conditions. 2-Observe that, if we could get rid of the first inequality, we could decompose the problem into two independent...

Study smarter with the SolutionInn App