

09 Grades MAVZone MAVzone Login profile New Tab Yousician Welcome to Color... f 7. Graphical treatment...
Fantastic news! We've Found the answer you've been seeking!
Question:

Transcribed Image Text:
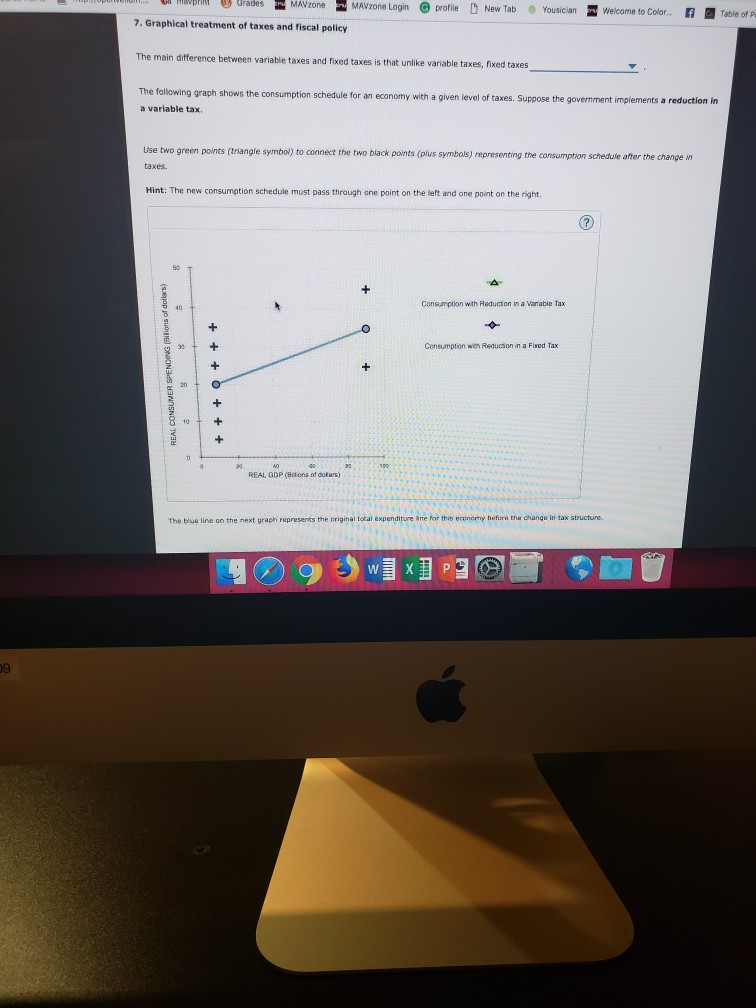
09 Grades MAVZone MAVzone Login profile New Tab Yousician Welcome to Color... f 7. Graphical treatment of taxes and fiscal policy The main difference between variable taxes and fixed taxes is that unlike variable taxes, fixed taxes The following graph shows the consumption schedule for an economy with a given level of taxes. Suppose the government implements a reduction in a variable tax. Use two green points (triangle symbol) to connect the two black points (plus symbols) representing the consumption schedule after the change in taxes. Hint: The new consumption schedule must pass through one point on the left and one point on the right. 50 40 + + + + 20 40 40 REAL GDP (Bilions of dollars) 80 + 300 W A Consumption with Reduction in a Variable Tax + Consumption with Reduction in a Fixed Tax NNNN! The blue line on the next graph represents the original total expenditure line for this economy before the change in tax structure. X (?) Table of Pr 09 REAL EXPENDITURE (Billio 00 40 1 30 20 0 10 30 40 50 60 70 REAL GDP (Billions of dollars) 50 10 avprint Grades MAVzone 0 20 True 80 False MAVZone Login profile New Tab 90 100 Suppose that the government also considered a fixed tax cut and that the resulting consumption schedule would have also passed through one black point (plus symbols) on the left and one black point on the right on the first graph (though not necessarily the same points as the consumption schedule resulting from the reduction in a variable tax). Copyright Notices On the first graph, use two purple points (diamond symbol) to connect the two black points (plus symbols) representing the consumption schedule that would result from a reduction in a fixed tax. (Hint: As before, the consumption schedule must pass through one point on the left and one point on the right.) True or False: The change in equilibrium output is greater when the government implements the fixed tax cut. O On the second graph, use the purple points (diamond symbols) to draw the total expenditure line that would result from a reduction in a fixed tax indicated on the top graph. TE with reduction in a fixed tax Terms of Use Privacy Notice W XI Yousician Security Notice O 0953838068855_0AAA6B970 Welcome to Color... A 43 Grade It Now Accessibility Save & Continue Continue without saving PA 09 Grades MAVZone MAVzone Login profile New Tab Yousician Welcome to Color... f 7. Graphical treatment of taxes and fiscal policy The main difference between variable taxes and fixed taxes is that unlike variable taxes, fixed taxes The following graph shows the consumption schedule for an economy with a given level of taxes. Suppose the government implements a reduction in a variable tax. Use two green points (triangle symbol) to connect the two black points (plus symbols) representing the consumption schedule after the change in taxes. Hint: The new consumption schedule must pass through one point on the left and one point on the right. 50 40 + + + + 20 40 40 REAL GDP (Bilions of dollars) 80 + 300 W A Consumption with Reduction in a Variable Tax + Consumption with Reduction in a Fixed Tax NNNN! The blue line on the next graph represents the original total expenditure line for this economy before the change in tax structure. X (?) Table of Pr 09 REAL EXPENDITURE (Billio 00 40 1 30 20 0 10 30 40 50 60 70 REAL GDP (Billions of dollars) 50 10 avprint Grades MAVzone 0 20 True 80 False MAVZone Login profile New Tab 90 100 Suppose that the government also considered a fixed tax cut and that the resulting consumption schedule would have also passed through one black point (plus symbols) on the left and one black point on the right on the first graph (though not necessarily the same points as the consumption schedule resulting from the reduction in a variable tax). Copyright Notices On the first graph, use two purple points (diamond symbol) to connect the two black points (plus symbols) representing the consumption schedule that would result from a reduction in a fixed tax. (Hint: As before, the consumption schedule must pass through one point on the left and one point on the right.) True or False: The change in equilibrium output is greater when the government implements the fixed tax cut. O On the second graph, use the purple points (diamond symbols) to draw the total expenditure line that would result from a reduction in a fixed tax indicated on the top graph. TE with reduction in a fixed tax Terms of Use Privacy Notice W XI Yousician Security Notice O 0953838068855_0AAA6B970 Welcome to Color... A 43 Grade It Now Accessibility Save & Continue Continue without saving PA
Expert Answer:

Related Book For 

Posted Date:
Students also viewed these economics questions
-
With a given level of world resources, international trade may bring about an increase in total world output. Explain.
-
With a given level of world resources, international trade may bring about an increase in total world output. Explain.
-
In the case of a consumer with a given level of income and the choice of spending that income on commodities X and Y, evaluate whether an excise tax on X or an equal-yield income tax will impose the...
-
Taxpayer sold the following capital assets during the year: Asset # 1: $60,000 long-term capital gain Asset # 2: $10,000 long-term capital loss Asset # 3: $50,000 short-term capital gain Asset # 4:...
-
1. Does this case mean that competitors may simply create a joint venture to avoid any liability for price-fixing? 2. Why did the retailers allege that forming this joint venture was anticompetitive...
-
Suppose you have enough linear dielectric material, of dielectric constant r, to half-fill a parallel-plate capacitor (Fig. 4.25). By what fraction is the capacitance increased when you distribute...
-
Determine if the mixed method aspect is concurrent, sequential,, or nested. Develop a hypothetical research scenario that would necessitate the use of the Mixed Method A-B-A Design. The research will...
-
Lisah, Inc., manufactures golf clubs in three models. For the year, the Big Bart line has a net loss of $10,000 from sales $200,000, variable costs $180,000, and fixed costs $30,000. If the Big Bart...
-
IKEA entered the United States in 1985 and China in 1998. But the company started in 1958; why did it take so long to move into the United States and China? Why do you think IKEA is not in more than...
-
Olive Enterprises experienced the following events during 2018: 1. Acquired cash from the issue of common stock. 2. Paid cash to reduce the principal on a bank note. 3. Sold land for cash at an...
-
A company is considering investing in a new project. The project has a potential return of $500,000 with a probability of 60% and a potential loss of $200,000 with a probability of 40%. The company...
-
In the context of s ocial policies implemented in Canada to mitigate the impact of the pandemic , would you agree or disagree that these policies are more favorable to women? (Please refer to the...
-
For the most current year end, did your selected corporation use cash to purchase property, plant, and equipment? If so, how much? If not, why?
-
From the book Actions of Disrupted: My Misadventure in the Start-Up Bubble , Lyons talks about "The Bozo Explosion" and how it impacts that kinds of people that end up working at HubSpot. These...
-
In the United States, a buyer of a new electric car is eligible for a one-time federal income tax credit of up to $5,000. Show the effect of this tax credit graphically, assuming the $5,000 credit is...
-
ABC has $32 million of inventory and $31 million of accounts receivable. Its average daily sales are $851,000 and its gross profit margin is 22 percent. The companys payables deferral period is 54.2...
-
K Compute the monthly payments for an add-on interest loan of $1450, with an annual interest rate of 8% and a term of 3 years. The monthly payment is S (Round to the nearest cent as needed.) REER
-
Use the T account for Cash below to record the portion of each of the following transactions, if any that affect cash. How do these transactions affect the companys liquidity? Jan. 2 Provided...
-
Now Ray asks you to look at the companys inventory position. He thinks that inventories might be too high as a result of the managers tendency to order in large quantities. Ray has decided to examine...
-
The Garvin Company is setting up a new checking account with Barngrover National Bank. Garvin plans to issue checks in the amount of $1.6 million each day and to deduct them from its own records at...
-
Janis Rafferty purchased 100 shares of Gold Depot common stock at the beginning of January for $25.00 per share. Janis received a $1.25 dividend payment from the company at the end of December. At...
-
A national news organization developed the graphic shown in Figure 22 to illustrate the change in the highest marginal tax rate effective January 1, 2013. Why might this graph be considered...
-
A home security company located in Minneapolis, Minnesota, develops a summer ad campaign with the slogan When you leave for vacation, burglars leave for work. According to the city of Minneapolis,...
-
Soccer continues to grow in popularity as a sport in the United States. High-profile players such as Hope Solo and Landon Donovan have helped generate renewed interest in the sport at various age...

Study smarter with the SolutionInn App