

(1) Calculate the debt-to-income ratio (DTI) and add it to the dataframe as a new column. Round...
Fantastic news! We've Found the answer you've been seeking!
Question:
(1) Calculate the debt-to-income ratio (DTI) and add it to the dataframe as a new column. Round the number to two decimal places. (Hint: DTI is total debt divided by income.)
(2) Use 15 bins to draw a histogram of DTI.
(3) Convert age to age group according to the table below.
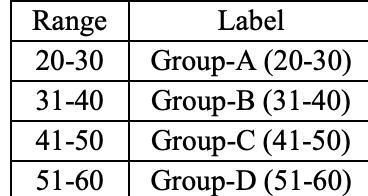
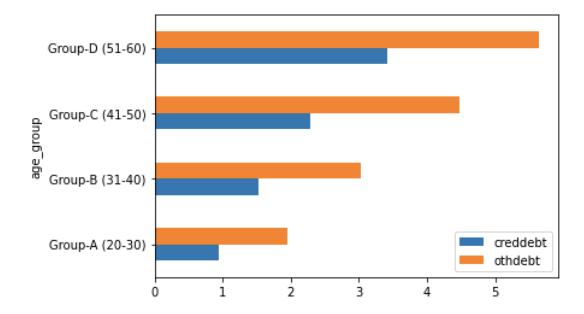
(4) Draw a horizontal multiple bar chart to show the average credit card debt and average other debt of each age group.
rows from csv.
default | age | employ | address | income | creddebt | othdebt |
1 | 41 | 17 | 12 | 176 | 11.359392 | 5.008608 |
0 | 27 | 10 | 6 | 31 | 1.362202 | 4.000798 |
0 | 40 | 15 | 14 | 55 | 0.856075 | 2.168925 |
0 | 41 | 15 | 14 | 120 | 2.65872 | 0.82128 |
Expert Answer:

Related Book For 

Income Tax Fundamentals 2013
ISBN: 9781285586618
31st Edition
Authors: Gerald E. Whittenburg, Martha Altus Buller, Steven L Gill
Posted Date:
