

1. Need to have at least 3 out of 5 attributes better than the benchmark (row...
Fantastic news! We've Found the answer you've been seeking!
Question:

Transcribed Image Text:
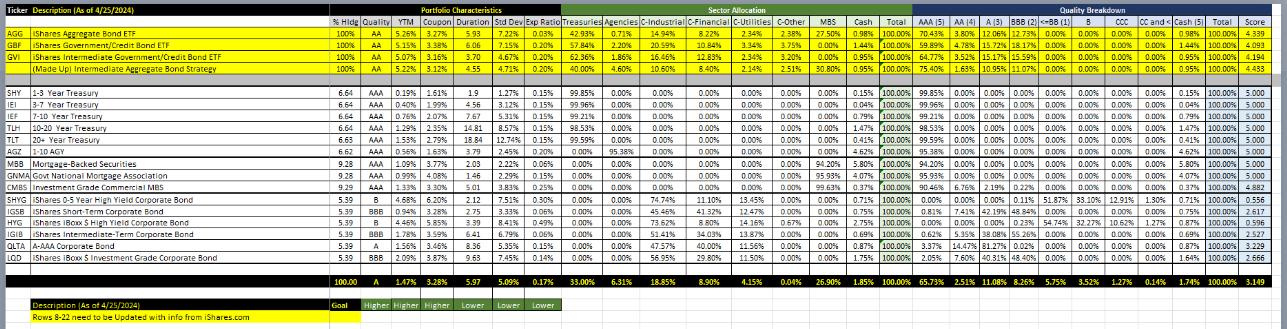
1. Need to have at least 3 out of 5 attributes better than the benchmark (row 26, Cells D-I), duration can be longer if you feel that the yields will drop 2. A minimum of 12 ETFS need to be used to build your portfolio, maximum allocation to AAA securities should be 10% and corporate ETFs be 7%, minimum allocation 2% across all ETFS 3. State the fees you plan to charge your client, your YTM need to exceed the benchmark's by at least that much 4. Your portfolio should be within two credit quality gradations versus the benchmark 5. State the environments when your portfolio will out and underperform the benchmark 6. Your outlook on the bond market (based on your benchmark) in the near term through the end of 2024 a paragraph, state various reasons: Fed expectations, Economy, Geopolitical factors, Investor behavior, Consumer sentiment, Supply chain disruptions, etc. Ticker Description (As of 4/25/2024) AGG Shares Aggregate Bond ETF GBF iShares Government/Credit Band ETF GVI iShares Intermediate Government/Credit Bond ETF (Made Up) Intermediate Aggregate Bond Strategy SHY 1-3 Year Treasury Portfolio Characteristics 100% AA 100% AA 100% AA AA 5.26% 3.27% 5.15% 3.38% 5.07% 3.16% 5.22 % 3.12% 0.20% 57.84% 2.20% Sector Allocation % Hide Quality YTM Coupon Duration Std Dev Exp Ratio Treasuries Agencies C-Industrial C-Financial C-Utilities C-Other MBS 5.93 7,22 % 0.03% 42.93% 0.71% 6.06 7.15% 3.70 4.67% 0.20% 62.36% 1.86% 4.55 4.71% 40.00% Quality Breakdown 14.94% 8.22% 20.59% 10.84% 2.34% 3.34% 16.46% 4.60% 10.60% 8.40% 2.14% 2.34% 3.20% 0.00% 30.80% AAA (5) AA [4] 2.38% 27.50% 0.98% 100.00% 70.43% 3.80% 3.75% 0.00% 1.44% 100.00% 59.89% 4.78% 0.95% 100.00% 64.77% 3.52 % 0.95% 100.00% 75.40% 1.63% Cash Total A (3) 888 (2)-88 (1) 12.06% 12.73% 0.00% 15.72 % 18.17 % 0.00 % 15.17 % 15.59 % 0.00 % 10.95% 11.07% 0.00% 0.00% COC CC and Cash (5) Total Score 0.00% 0.00% 0.98% 100.00% 4.339 0.00% 1.44% 100.00% 4.093 0.00% 0.00% 0.00% 0.95% 100.00% 4.194 0.00% 0.00% 0.00% 0.95% 100.00% 4.433 6.64 AAA 0.19 % TLH 3-7 Year Treasury IEF 7-10 Year Treasury 10-20 Year Treasury TLT 20+ Year Treasury AGZ 6.64 1.61% 0.40% 1.99% 1.9 6.64 AAA 0.76% 2.07% 1.27% 0.15% 4.56 3.12% 0.15% 99.96% 0.00% 5.31% 0.15% 99.21% 99.85% 0.00% 0.00% 0.00% 0.00% 0.00% 0.00% 0.00% 0.00% 0.00% 0.00% 0.00% 0.00% 0.00% 0.00% 0.00% 6.64 AAA 6.63 HYG 1-10 AGY MBB Mortgage-Backed Securities GNMA Govt National Mortgage Association CMBS Investment Grade Commercial MBS SHYG Shares 0-5 Year High Yield Corporate Bond IGSB Shares Short Term Corporate Bond Shares iBoxx $ High Yield Corporate Bond IGIB iShares Intermediate-Term Corporate Bond QLTA A-AAA Corporate Bond 6.62 9.28 9.28 9.29 5.39 5.39 LQD iShares iBoxx $ Investment Grade Corporate Bond 888 5.39 B 5.39 BBB 5.39 A 5.39 BBB 2.35% AAA 1.53% 2.79% AAA 0.56% 1.63% AAA 1.09% 3.77% AAA 0.99% 4.08% AAA 1.33% 3.30% 4.68% 6.20% 0.94% 3.28% 4.45% 5.85% 14.81 18.84 3.79 0.15% 98.53% 12.74% 0.15% 2.45% 0.20% 0.00% 0.00% 0.00% 0.00% 0.00% 0.00% 0.00% 0.00% 0.00% 0.00% 0.00% 0.00% 0.00% 0.00% 95.38% 0.00% 0.00% 2.03 2.22% 0.06% 146 2.29% 0.15% 0.00% 0.00% 0.00% 0.00% 0.00% 0.00% 0.00% 94.20% 5.80% 0.15% 100.00% 99.85% 0.00% 0.00% 0.00% 0.04% 100.00% 99.96% 0.00% 0.00% 0.00% 0.79% 100.00% 99.21% 0.00% 0.00% 0.00% 1.47% 100.00% 98.53% 0.00% 0.00% 0.00% 0.41% 100.00% 99.59% 0.00% 0.00% 0.00% 4.62% 100,00% 95.38% 100.00%|| 94.20% 0.00% 0.00% 0.00% 0.00% 0.15% 100.00% 5.000 0.00% 0.00% 0.00% 0.00% 0.04% 100.00% 5.000 0.00% 0.00% 0.00% 0.00% 0.00% 0.00% 0.00% 0.00% 0.00% 0.00% 0.00% 0.00% 0.00% 0.00% 0.00% 0.00% 0.00% 0.79% 100.00% 5.000 1.47% 100.00% 5.000 0.41% 100.00% 5.000 4.62% 100.00% 5.000 0.00% 5.80% 100.00% 5.000 0.00% 0.00% 0.00% 0.00% 5.01 1.78% 3.59% 1.56% 3.46% 2.09% 3.87% 3.83% 0.25% 7.51% 0.30% 2.75 3.33% 0.06% 3.39 8.41% 0.49% 6.41 6.79% 0.06% 8.36 5.35% 0.15% 9.63 7.45% 0.14% 0.00% 0.00% 0.00% 0.00% 0.00% 0.00% 0.00% 0.00% 74.74% 45.45% 0.00% 0.00% 73.62% 0.00% 0.00% 51.41% 0.00% 0.00% 47.57% 0.00% 0.00% 56.95% 40.00% 29.80% 0.00% 11.10% 13.45% 0.00% 41.32% 12.47% 0.00% 8.80% 14.16% 067% 34.03% 13.87% 0.00% 11.56% 0.00% 11.50% 0.00% 0.00% 0.00% 95.93% 4.07 % 99.63% 0.37% 100.00% 90.46% 0.71% 100.00% 0,75% 100,00% 0.81% 0.00% 2.75% 100.00% 0.00% 0.00% 0.69% 100.00% 0.62% 0.00% 0.87% 100.00% 3.37% 0.00% 1.75% 100.00% 2.05% 100.00% 95.93% 0.00% 0.00% 0.00% 0.00% 0.00% 0.00% 0.00% 4.07% 100.00% 5.000 6.76% 2.19% 0.22% 0.00% 0.00% 0.00% 0.00% 0.00% 0.00% 0.11% 51.87 % 33.10% 12.91 % 1.30% 7.41 % 42.19 % 48.84% 0.00% 0.00% 0.00% 0.00% 0.00% 0.00% 0.23% 54.74% 32.27% 10.62% 1.27% 5.35% 38.08% 55.26% 0.00% 0.00% 0.00% 0.00% 14.47 % 81.27% 0.02 % 0.00% 0.00% 0.00% 0.00% 7.60% 40.31% 48.40% 0.00% 0.00% 0.00% 0.00% 0.37% 100.00% 4.882 0.71% 100.00% 0.556 0.75% 100.00% 2.617 0.87% 100.00% 0.596 0.69% 100.00% 2.527 0.87% 100.00% 3.229 1.64% 100.00% 2.666 100.00 A 1.47% 3.28% 5.97 5.09% 0.17% 33.00% 6.31 % 18.85% 8.90% 4.15% 0.04% 26.90% 1.85% 100.00% 65.73% 2.51% 11.08% 8.25% 5.75% 3.52% 1.27% 0.14% 1.74% 100.00% 3.149 Description (As of 4/25/2024) Rows 8-22 need to be Updated with info from iShares.com Goal Higher Higher Higher Lower Lower Lower 1. Need to have at least 3 out of 5 attributes better than the benchmark (row 26, Cells D-I), duration can be longer if you feel that the yields will drop 2. A minimum of 12 ETFS need to be used to build your portfolio, maximum allocation to AAA securities should be 10% and corporate ETFs be 7%, minimum allocation 2% across all ETFS 3. State the fees you plan to charge your client, your YTM need to exceed the benchmark's by at least that much 4. Your portfolio should be within two credit quality gradations versus the benchmark 5. State the environments when your portfolio will out and underperform the benchmark 6. Your outlook on the bond market (based on your benchmark) in the near term through the end of 2024 a paragraph, state various reasons: Fed expectations, Economy, Geopolitical factors, Investor behavior, Consumer sentiment, Supply chain disruptions, etc. Ticker Description (As of 4/25/2024) AGG Shares Aggregate Bond ETF GBF iShares Government/Credit Band ETF GVI iShares Intermediate Government/Credit Bond ETF (Made Up) Intermediate Aggregate Bond Strategy SHY 1-3 Year Treasury Portfolio Characteristics 100% AA 100% AA 100% AA AA 5.26% 3.27% 5.15% 3.38% 5.07% 3.16% 5.22 % 3.12% 0.20% 57.84% 2.20% Sector Allocation % Hide Quality YTM Coupon Duration Std Dev Exp Ratio Treasuries Agencies C-Industrial C-Financial C-Utilities C-Other MBS 5.93 7,22 % 0.03% 42.93% 0.71% 6.06 7.15% 3.70 4.67% 0.20% 62.36% 1.86% 4.55 4.71% 40.00% Quality Breakdown 14.94% 8.22% 20.59% 10.84% 2.34% 3.34% 16.46% 4.60% 10.60% 8.40% 2.14% 2.34% 3.20% 0.00% 30.80% AAA (5) AA [4] 2.38% 27.50% 0.98% 100.00% 70.43% 3.80% 3.75% 0.00% 1.44% 100.00% 59.89% 4.78% 0.95% 100.00% 64.77% 3.52 % 0.95% 100.00% 75.40% 1.63% Cash Total A (3) 888 (2)-88 (1) 12.06% 12.73% 0.00% 15.72 % 18.17 % 0.00 % 15.17 % 15.59 % 0.00 % 10.95% 11.07% 0.00% 0.00% COC CC and Cash (5) Total Score 0.00% 0.00% 0.98% 100.00% 4.339 0.00% 1.44% 100.00% 4.093 0.00% 0.00% 0.00% 0.95% 100.00% 4.194 0.00% 0.00% 0.00% 0.95% 100.00% 4.433 6.64 AAA 0.19 % TLH 3-7 Year Treasury IEF 7-10 Year Treasury 10-20 Year Treasury TLT 20+ Year Treasury AGZ 6.64 1.61% 0.40% 1.99% 1.9 6.64 AAA 0.76% 2.07% 1.27% 0.15% 4.56 3.12% 0.15% 99.96% 0.00% 5.31% 0.15% 99.21% 99.85% 0.00% 0.00% 0.00% 0.00% 0.00% 0.00% 0.00% 0.00% 0.00% 0.00% 0.00% 0.00% 0.00% 0.00% 0.00% 6.64 AAA 6.63 HYG 1-10 AGY MBB Mortgage-Backed Securities GNMA Govt National Mortgage Association CMBS Investment Grade Commercial MBS SHYG Shares 0-5 Year High Yield Corporate Bond IGSB Shares Short Term Corporate Bond Shares iBoxx $ High Yield Corporate Bond IGIB iShares Intermediate-Term Corporate Bond QLTA A-AAA Corporate Bond 6.62 9.28 9.28 9.29 5.39 5.39 LQD iShares iBoxx $ Investment Grade Corporate Bond 888 5.39 B 5.39 BBB 5.39 A 5.39 BBB 2.35% AAA 1.53% 2.79% AAA 0.56% 1.63% AAA 1.09% 3.77% AAA 0.99% 4.08% AAA 1.33% 3.30% 4.68% 6.20% 0.94% 3.28% 4.45% 5.85% 14.81 18.84 3.79 0.15% 98.53% 12.74% 0.15% 2.45% 0.20% 0.00% 0.00% 0.00% 0.00% 0.00% 0.00% 0.00% 0.00% 0.00% 0.00% 0.00% 0.00% 0.00% 0.00% 95.38% 0.00% 0.00% 2.03 2.22% 0.06% 146 2.29% 0.15% 0.00% 0.00% 0.00% 0.00% 0.00% 0.00% 0.00% 94.20% 5.80% 0.15% 100.00% 99.85% 0.00% 0.00% 0.00% 0.04% 100.00% 99.96% 0.00% 0.00% 0.00% 0.79% 100.00% 99.21% 0.00% 0.00% 0.00% 1.47% 100.00% 98.53% 0.00% 0.00% 0.00% 0.41% 100.00% 99.59% 0.00% 0.00% 0.00% 4.62% 100,00% 95.38% 100.00%|| 94.20% 0.00% 0.00% 0.00% 0.00% 0.15% 100.00% 5.000 0.00% 0.00% 0.00% 0.00% 0.04% 100.00% 5.000 0.00% 0.00% 0.00% 0.00% 0.00% 0.00% 0.00% 0.00% 0.00% 0.00% 0.00% 0.00% 0.00% 0.00% 0.00% 0.00% 0.00% 0.79% 100.00% 5.000 1.47% 100.00% 5.000 0.41% 100.00% 5.000 4.62% 100.00% 5.000 0.00% 5.80% 100.00% 5.000 0.00% 0.00% 0.00% 0.00% 5.01 1.78% 3.59% 1.56% 3.46% 2.09% 3.87% 3.83% 0.25% 7.51% 0.30% 2.75 3.33% 0.06% 3.39 8.41% 0.49% 6.41 6.79% 0.06% 8.36 5.35% 0.15% 9.63 7.45% 0.14% 0.00% 0.00% 0.00% 0.00% 0.00% 0.00% 0.00% 0.00% 74.74% 45.45% 0.00% 0.00% 73.62% 0.00% 0.00% 51.41% 0.00% 0.00% 47.57% 0.00% 0.00% 56.95% 40.00% 29.80% 0.00% 11.10% 13.45% 0.00% 41.32% 12.47% 0.00% 8.80% 14.16% 067% 34.03% 13.87% 0.00% 11.56% 0.00% 11.50% 0.00% 0.00% 0.00% 95.93% 4.07 % 99.63% 0.37% 100.00% 90.46% 0.71% 100.00% 0,75% 100,00% 0.81% 0.00% 2.75% 100.00% 0.00% 0.00% 0.69% 100.00% 0.62% 0.00% 0.87% 100.00% 3.37% 0.00% 1.75% 100.00% 2.05% 100.00% 95.93% 0.00% 0.00% 0.00% 0.00% 0.00% 0.00% 0.00% 4.07% 100.00% 5.000 6.76% 2.19% 0.22% 0.00% 0.00% 0.00% 0.00% 0.00% 0.00% 0.11% 51.87 % 33.10% 12.91 % 1.30% 7.41 % 42.19 % 48.84% 0.00% 0.00% 0.00% 0.00% 0.00% 0.00% 0.23% 54.74% 32.27% 10.62% 1.27% 5.35% 38.08% 55.26% 0.00% 0.00% 0.00% 0.00% 14.47 % 81.27% 0.02 % 0.00% 0.00% 0.00% 0.00% 7.60% 40.31% 48.40% 0.00% 0.00% 0.00% 0.00% 0.37% 100.00% 4.882 0.71% 100.00% 0.556 0.75% 100.00% 2.617 0.87% 100.00% 0.596 0.69% 100.00% 2.527 0.87% 100.00% 3.229 1.64% 100.00% 2.666 100.00 A 1.47% 3.28% 5.97 5.09% 0.17% 33.00% 6.31 % 18.85% 8.90% 4.15% 0.04% 26.90% 1.85% 100.00% 65.73% 2.51% 11.08% 8.25% 5.75% 3.52% 1.27% 0.14% 1.74% 100.00% 3.149 Description (As of 4/25/2024) Rows 8-22 need to be Updated with info from iShares.com Goal Higher Higher Higher Lower Lower Lower
Expert Answer:

Related Book For 

Posted Date:
Students also viewed these finance questions
-
The management of a New York area investment firm wants to find out about the investment needs of its existing customers, for which it has an extensively detailed list, as a function of their...
-
A meat-processing company in the Midwest produces and markets a package of eight small sausage sandwiches. The product is nationally distributed, and the company is interested in knowing the average...
-
Speegleville Marina needs to raise \(\$ 1\) million to expand. Speegleville's president is considering two plans: - Plan A: Issue \(\$ 1,000,000\) of \(8 \%\) bonds payable to borrow the money - Plan...
-
What disclosures should be made by lessees and lessors related to future lease payments?
-
! Required information [The following information applies to the questions displayed below] Iguana, Incorporated, manufactures bamboo picture frames that sell for $25 each. Each frame requires 4...
-
A 25.0 kg asteroid initially at rest and located at 6.37 x 10 10 m from the center of Earth accelerates toward Earth due to Earth's gravity. What is the speed of the asteroid (in km/s) when it...
-
To what extent, if any, do the prospective financial gains of the banks' shareholders represent transfers of value from other claimholders, such as bank customers, employees, and communities in which...
-
Given the risk-neutral process dS/S = rdt + odz, with o being constant, show that E(STST...ST | SO) = Sexp(-1(r + (k-i)o)T), for T...> T > T (b) Consider an average price at time T defined as ht= =...
-
A particle moves along the x-axis and its position in feet at any time t> 1 sec is described by the function f (x) = sin(). What is its velocity at 5/3 sec? -
-
Imagine that a given investment bank generated a return on assets of 10% which lead to a doubling of bank capital. What was the asset to equity ratio in this bank?
-
Explains the current makeup of the Legislative Branch in the United States. Identify which parts of the above plans are reflected in the current government.

Study smarter with the SolutionInn App