

1. Table 1 displays the heights of the presidents and their opponents in the U.S. presidential election...
Question:
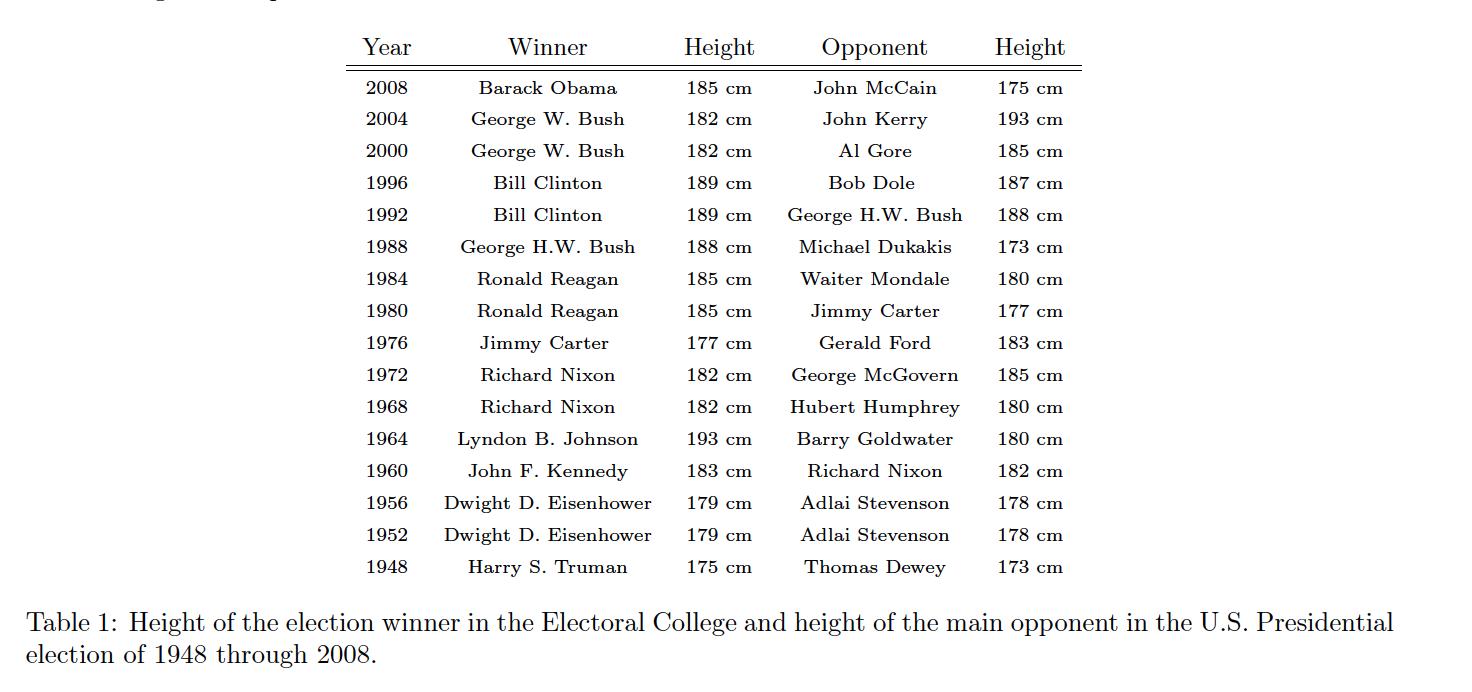
1. Table 1 displays the heights of the presidents and their opponents in the U.S. presidential election of 1948 through 2008.
Using R.
(a) Enter the data in R as a data frame with 3 columns: year, winner and opponent. Enter the height of the winner candidate in the column winner, the height of the opponent candidate in the column opponent.
(b) Create a dataframe with the same elds as before, but including an additional column called differences which is the differences in height between the winner and opponent in the column difference
(c) Add a new column taller.won to your data frame in (a) with logical values (TRUE/FALSE) determining whether the taller candidate won the election.
(d) Use the table function to display percentages of TRUE/FALSE in the column taller.won. Interpret the result.
(e) Display a bar plot of the difference column. Use the rev function to reverse the order of the differences so that the election year is increasing from left to right.
(f) Using the function, write.table() perhaps, save the table obtained in 1(c) above in a new file called heights.csv. (Note that you do not have to turn in the created file just the complete function that you used.) Make sure that the created le is as you would like.
Expert Answer:


Income Tax Fundamentals 2013
ISBN: 9781285586618
31st Edition
Authors: Gerald E. Whittenburg, Martha Altus Buller, Steven L Gill
