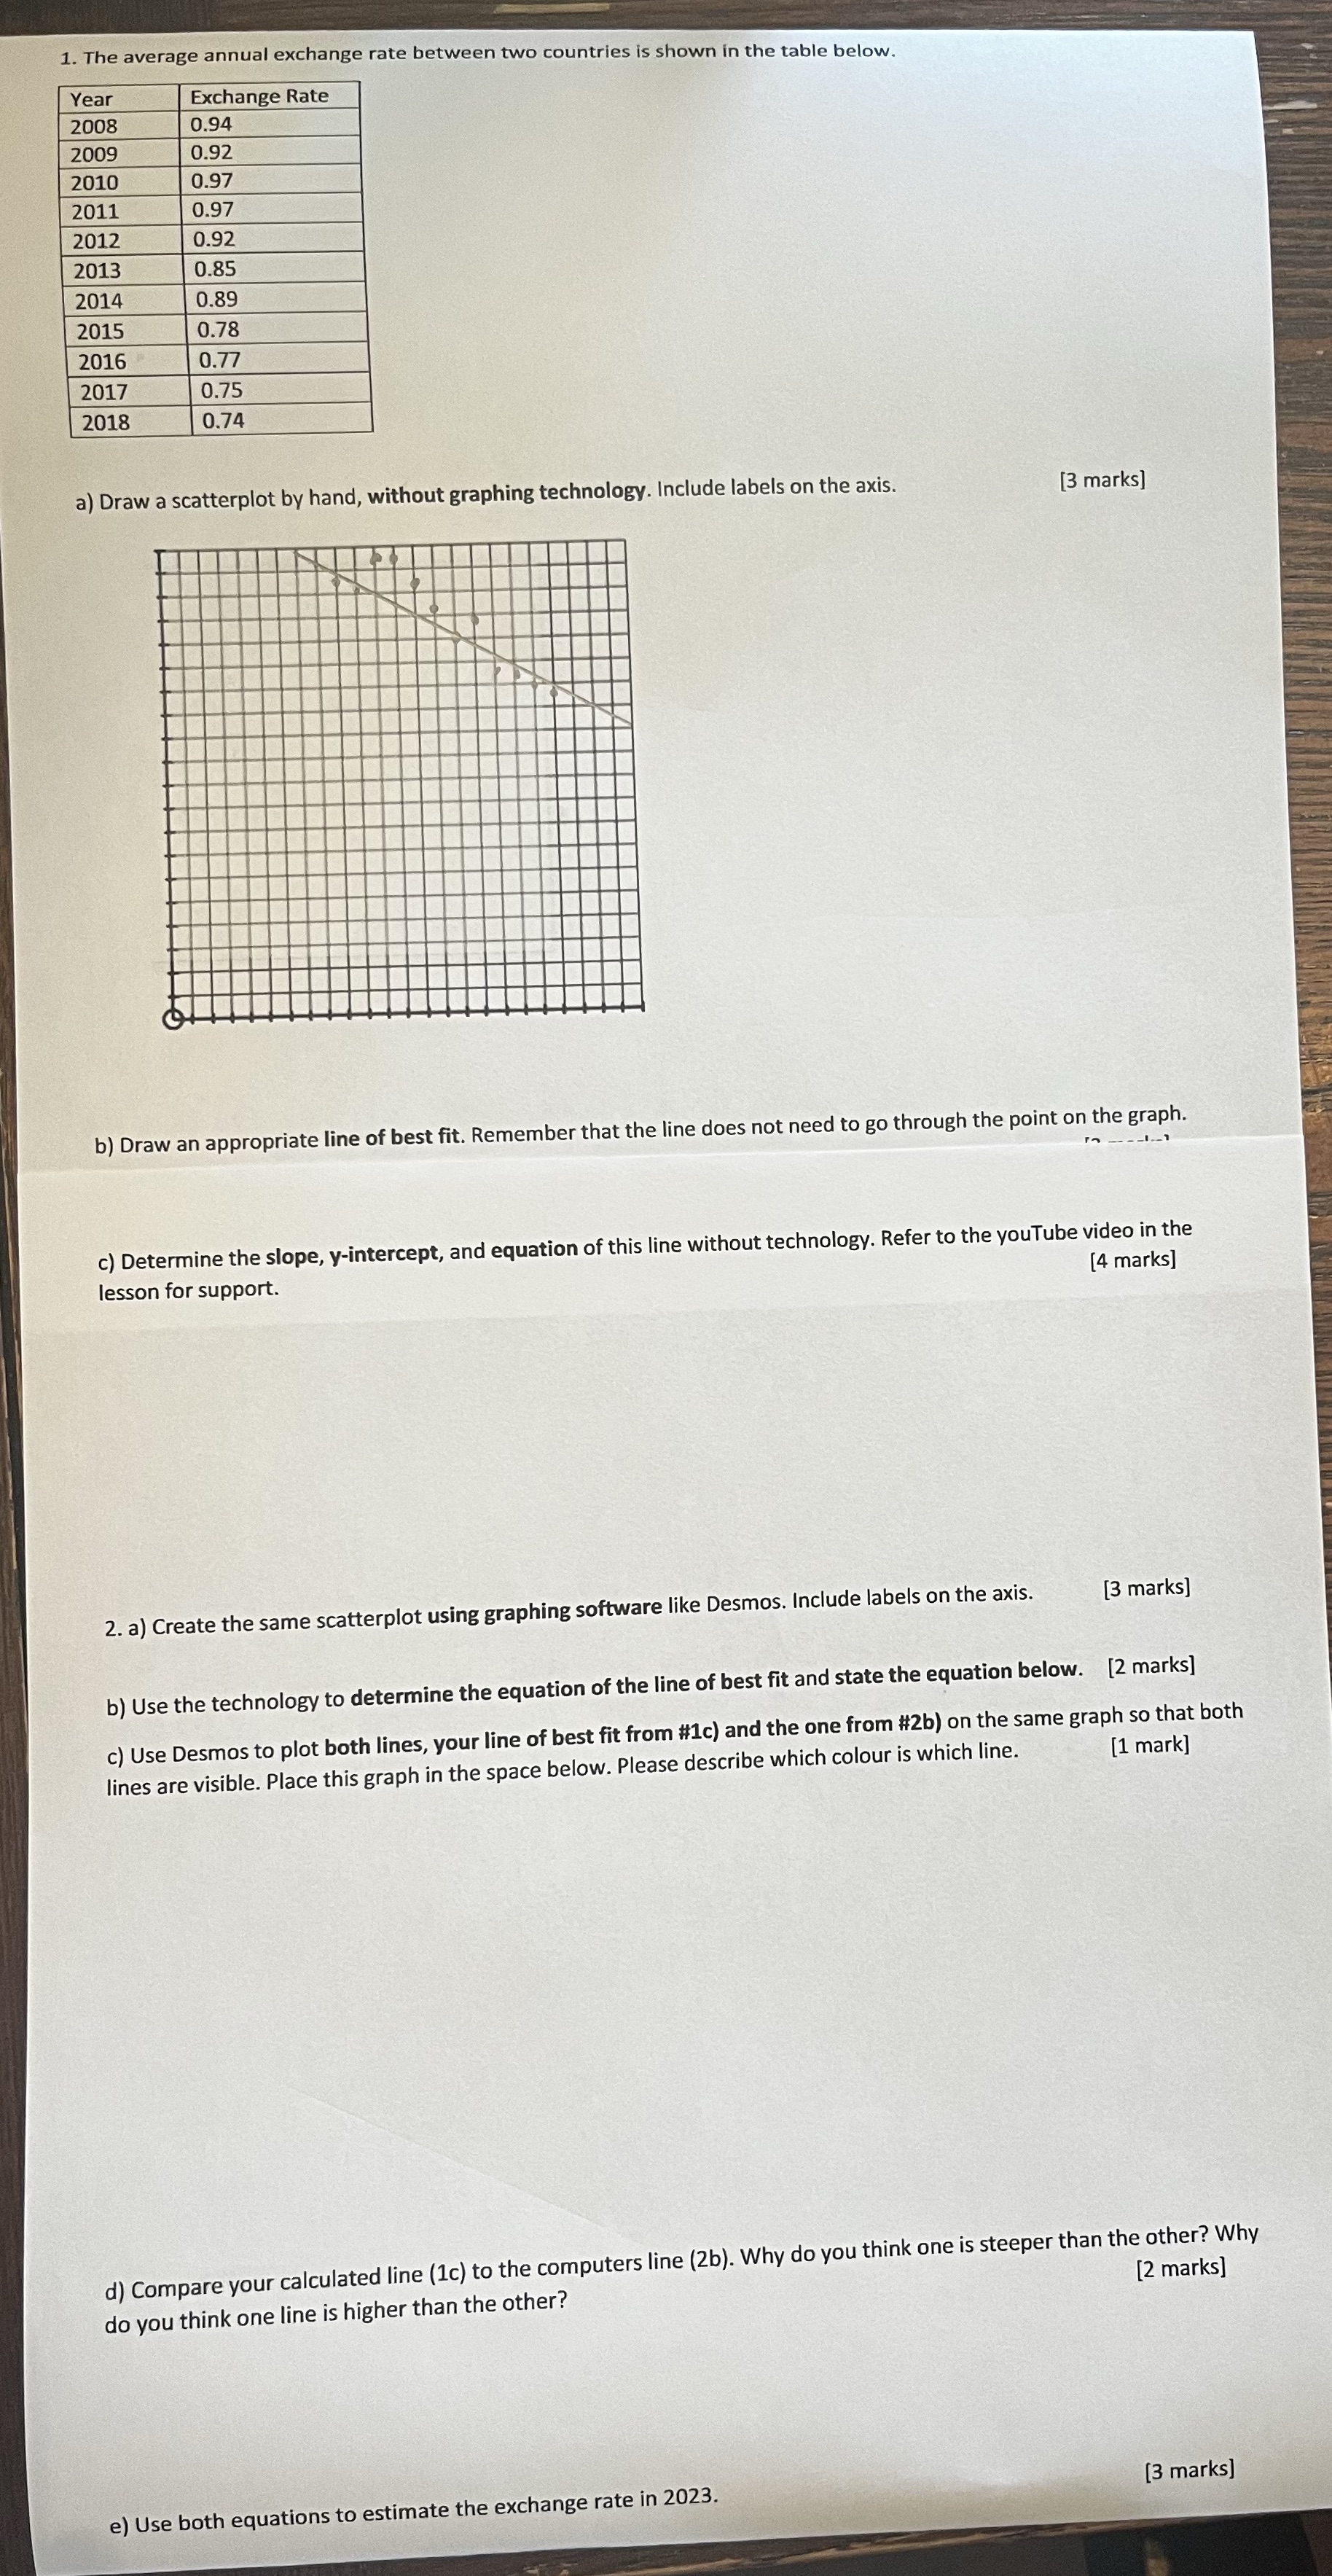
1. The average annual exchange rate between two countries is shown in the table below. Year...
Fantastic news! We've Found the answer you've been seeking!
Question:
Transcribed Image Text:
1. The average annual exchange rate between two countries is shown in the table below. Year Exchange Rate 2008 0.94 2009 0.92 2010 0.97 2011 0.97 2012 0.92 2013 0.85 2014 0.89 2015 0.78 2016 0.77 2017 0.75 2018 0.74 a) Draw a scatterplot by hand, without graphing technology. Include labels on the axis. [3 marks] b) Draw an appropriate line of best fit. Remember that the line does not need to go through the point on the graph. c) Determine the slope, y-intercept, and equation of this line without technology. Refer to the youTube video in the lesson for support. [4 marks] 2. a) Create the same scatterplot using graphing software like Desmos. Include labels on the axis. [3 marks] b) Use the technology to determine the equation of the line of best fit and state the equation below. [2 marks] [1 mark] c) Use Desmos to plot both lines, your line of best fit from #1c) and the one from #2b) on the same graph so that both lines are visible. Place this graph in the space below. Please describe which colour is which line. d) Compare your calculated line (1c) to the computers line (2b). Why do you think one is steeper than the other? Why do you think one line is higher than the other? [2 marks] e) Use both equations to estimate the exchange rate in 2023. [3 marks] 1. The average annual exchange rate between two countries is shown in the table below. Year Exchange Rate 2008 0.94 2009 0.92 2010 0.97 2011 0.97 2012 0.92 2013 0.85 2014 0.89 2015 0.78 2016 0.77 2017 0.75 2018 0.74 a) Draw a scatterplot by hand, without graphing technology. Include labels on the axis. [3 marks] b) Draw an appropriate line of best fit. Remember that the line does not need to go through the point on the graph. c) Determine the slope, y-intercept, and equation of this line without technology. Refer to the youTube video in the lesson for support. [4 marks] 2. a) Create the same scatterplot using graphing software like Desmos. Include labels on the axis. [3 marks] b) Use the technology to determine the equation of the line of best fit and state the equation below. [2 marks] [1 mark] c) Use Desmos to plot both lines, your line of best fit from #1c) and the one from #2b) on the same graph so that both lines are visible. Place this graph in the space below. Please describe which colour is which line. d) Compare your calculated line (1c) to the computers line (2b). Why do you think one is steeper than the other? Why do you think one line is higher than the other? [2 marks] e) Use both equations to estimate the exchange rate in 2023. [3 marks]
Expert Answer:
Related Book For
Foundations of Financial Management
ISBN: 978-1259024979
10th Canadian edition
Authors: Stanley Block, Geoffrey Hirt, Bartley Danielsen, Doug Short, Michael Perretta
Posted Date:
Students also viewed these mathematics questions
-
List three specific parts of the Case Guide, Objectives and Strategy Section (See below) that you had the most difficulty understanding. Describe your current understanding of these parts. Provide...
-
DON'T SUMMARIZE JUST PARAGRAPH OF WHAT YOU THOUGHT/LEARNED CHAPTER 13 - The phrase "garbage in, garbage out" highlights the importance of input controls. If the data entered into a system are...
-
It is an extremely hot and sunny day on Far Rockaway beach. However, there is only one shop selling non-dairy ice cream; the shop is a monopolist retailer of ice cream. There are two types of people...
-
Martha owns 500 shares of Columbus corporation common stock at the beginning of the year with a basis of $82,500. During the year, Columbus declares and pays a 10% no taxable stock dividend. What is...
-
R&D investments are a major source of business uncertainty. Do all risk-averse managers fail to invest in R&D? Why or why not?
-
A European recession and the U.S. economy a. In 2014, European Union spending on U.S. goods accounted for \(18 \%\) of U.S. exports (see Table 17-2), and U.S. exports amounted to \(15 \%\) of U.S....
-
R. C. Coleman distributes a variety of food products that are sold through grocery store and supermarket outlets. The company receives orders directly from the individual outlets, with a typical...
-
8. Two dice are rolled. Let A represent rolling a sum greater than 7. Let B represent rolling a sum that is a multiple of 3. Determine n(AB). A. 5 B. 8 C. 12 D. 15 Long Answer: Show all work for the...
-
Wholesome Snacks, Inc., the maker of a variety of cookies and crackers, has just created a new vitamin-packed cookie. The new cookie has the potential to combat many of the health problems caused by...
-
Find an exact formula for the number of %'s performed by the following algorithm in terms of a and b: uint gcd1(uint a, uintb) { } for (uint d = min (a, b); d > 0; --d) if (a % d == 0 && b % d == 0)...
-
For the following code segment, the worst-case runtime in Big O notation: int x = 0; for(int i=0; i
-
A 10.0 kg toboggan slides down a frictionless icy hill with a slope of 25.0. a) Calculate the parallel component of the toboggan's weight. b) Calculate the acceleration of the toboggan
-
Write a JAVA code snippet that uses a while loop to output the following to the screen. Repeat the same task by replacing the while loop by a for loop. 2 4 6 8 10 Goodbye!
-
1. (a) Suppose a List list1 has elements "A", "B", "C", and "D". What is returned by: 1. list1.iterator () .next(); 2. list1.listIterator 3. list1.listIterator 4. list1.listIterator (4).previous();...
-
Part A: Luxury Living Concepts Corp. (LLC) is a publicly accountable enterprise that builds large complexes, including schools, office towers, apartment buildings and shopping centres, on a contract...
-
Which of the followingcarbocations is the least stable? CH3CH2 . CH3CHCH3 CH3 I . CH3C0 T CH3 IV. V. CH3 CH3CCH2 CH3
-
Comment on the market performance of companies going public, both immediately after the offering has been made and some time later. Relate this to research that has been done in this area.
-
Discuss the changes currently occurring in Canada's financial and regulatory environment.
-
Why must one be careful when using sensitivity analysis?
-
Michael is in his last year of undergraduate studies in human services and economics and is conducting original research for his final research project. As part of his project, he is required to keep...
-
Keza is studying online for a masters degree in Management and wishes to undertake her research project in her home country, Rwanda, where she works as a civil servant. Due to her high pressure job,...
-
You wish to study the reasons why car owners join manufacturer-sponsored owners clubs. You choose to use a qualitative methodology and narrative inquiry research strategy involving unstructured...
Study smarter with the SolutionInn App